MoBIE
MultiModal Big Image Data Sharing and Exploration
Using BigVolumeViewer
By selecting a B checkbox in the Sources panel, you can view a 3D dataset/segmentation results in the BigVolumeViewer (BVV) window.

BVV navigation controls (rotation, zoom, etc) are the same as in BigDataViewer.
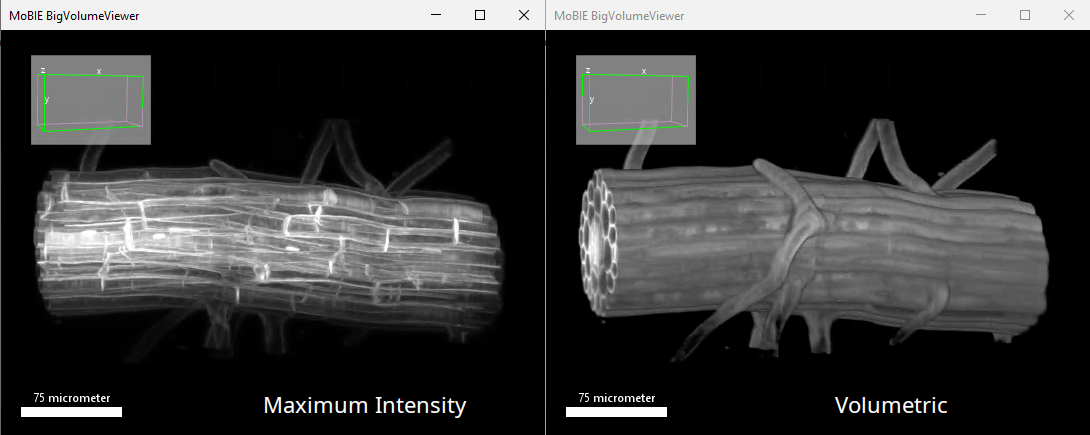
It supports two rendering modes: Maximum Intensity projection and Volumetric (translucent/alpha compositing), see an example below.
You can toggle between them using the keyboard shortcut O (letter, not a number).
You can synchronize the dataset view (and timepoint) with the BigDataViewer window view using shortcut D.
Compared with 3DViewer volume rendering using a fixed resolution, BVV works directly with the raw data. It loads corresponding multi-resolution data levels depending on the current view. It also supports the view of time-lapse datasets.
For the 3D volume rendering substantially more data is required to be loaded and processed, therefore for a smoother experience in displaying remote datasets it is recommended to use high-speed network connections.
As with all 3D applications, a better GPU card with a large amount of GPU memory is recommended. You can adjust the amount of dedicated GPU memory and tweak quality/performance using BVV setting command (explained below).
Adjusting color, LUTs and brightness
As with BigDataViewer, you can configure the appearance of each source in BVV using shortcut S (also in the Cards Panel, activated by a shortcut P).
The square on the left shows a color that is used to display the volume.
You can change it using the left-click. Or you can apply Fiji-installed LUT using right-click.
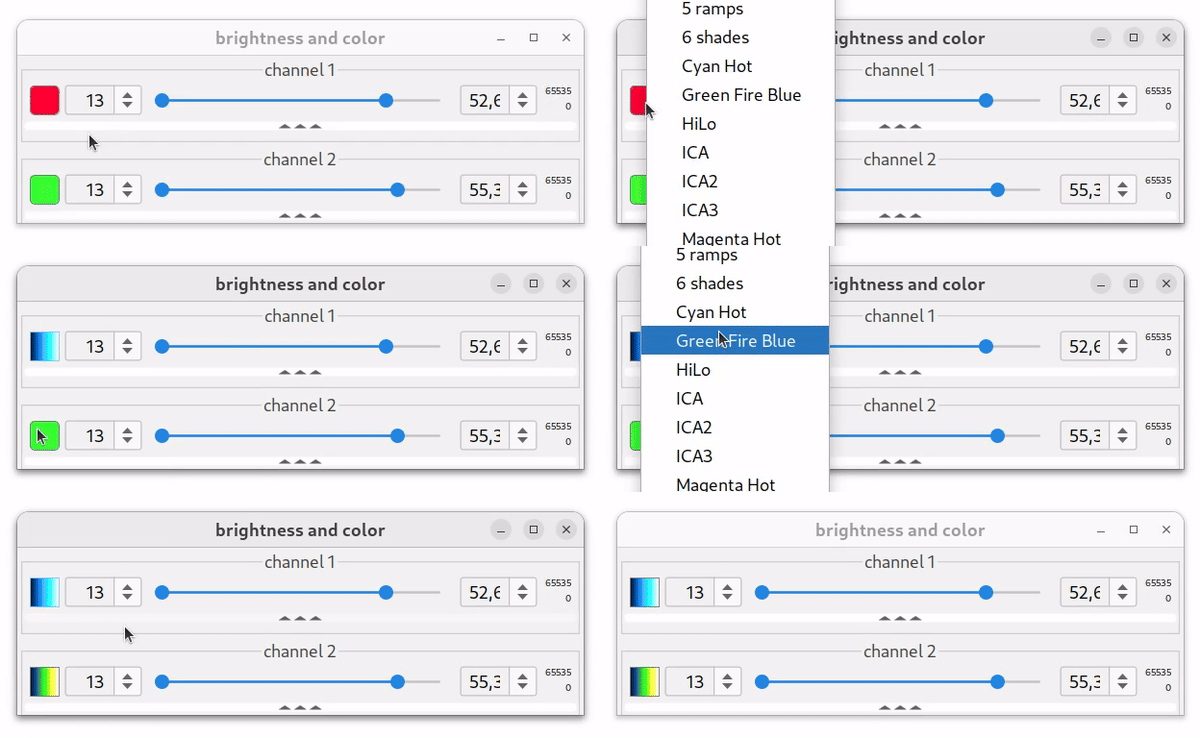
The top range slider maps the minimum and maximum shade of the selected source color (or min and max of LUT) to the selected data range (like a standard Fiji’s “brightness” dialog).
Slider’s range bounds can be edited using right click on the small numbers on the right.
Upon loading a source to BVV, its contrast and range will be taken from the current BDV source settings.
There are additional source display settings, which you can expand by clicking on the “three triangles” bar:
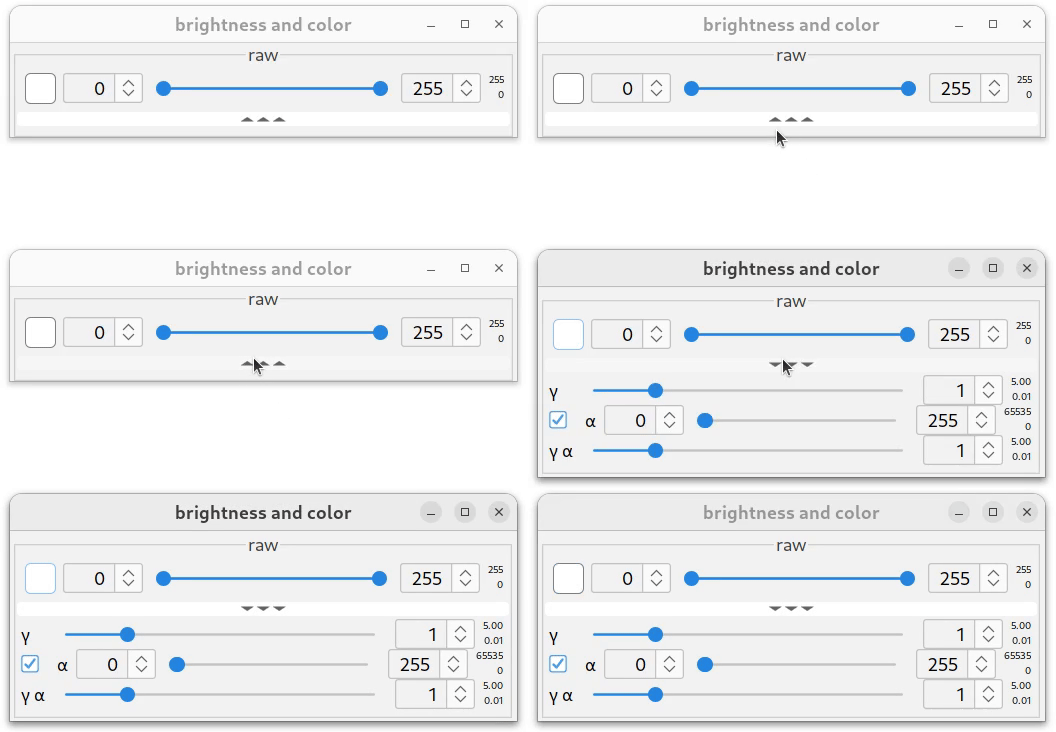
The second slider from the top (marked as γ) adjusts non-linear color/LUT mapping by introducing gamma correction (a power-law). Overall color/LUT adjustments can be illustrated using the example below.
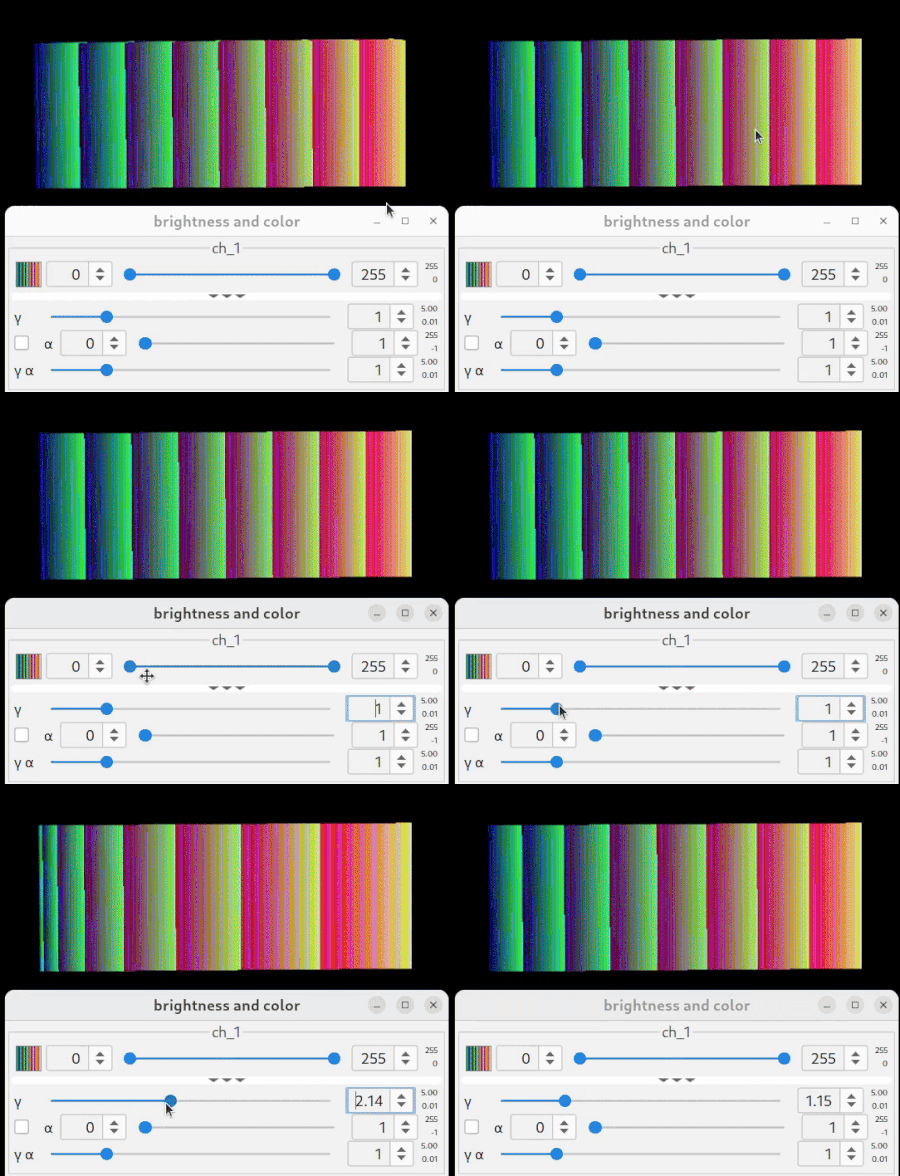
Here we have a box volume, where intensities are increasing from 0 to 255, left-to-right slices. Intensity values are colored using ImageJ’s periodic “3-3-2” LUT shown in the color bar. Changing min max range values of the top slider maps the range of LUT application with respect to the data (voxel values) range. Changing the gamma slider introduces non-linear color mapping.
Adjusting opacity
Two bottom sliders adjust (or map) voxels’ opacity, also called alpha value. It is especially important for the “Volumetric” rendering mode.
The range slider marked with α (alpha) maps the opacity range (0 = fully transparent, 1 = fully opaque) to the data intensity range. The very bottom slider, again, introduces independent non-linear gamma modulation of this mapping, marked “γ α”.
Now, let’s return to the animation shown above. It was made using a “volumetric” render. As you may see, the alpha slider range was set from 0 to 1, meaning that all voxels with intensity above or equal to 1 have an opacity of 1 (completely opaque).
The example shown below shows what will happen with a source view if we independently change opacity (alpha value) mapping.
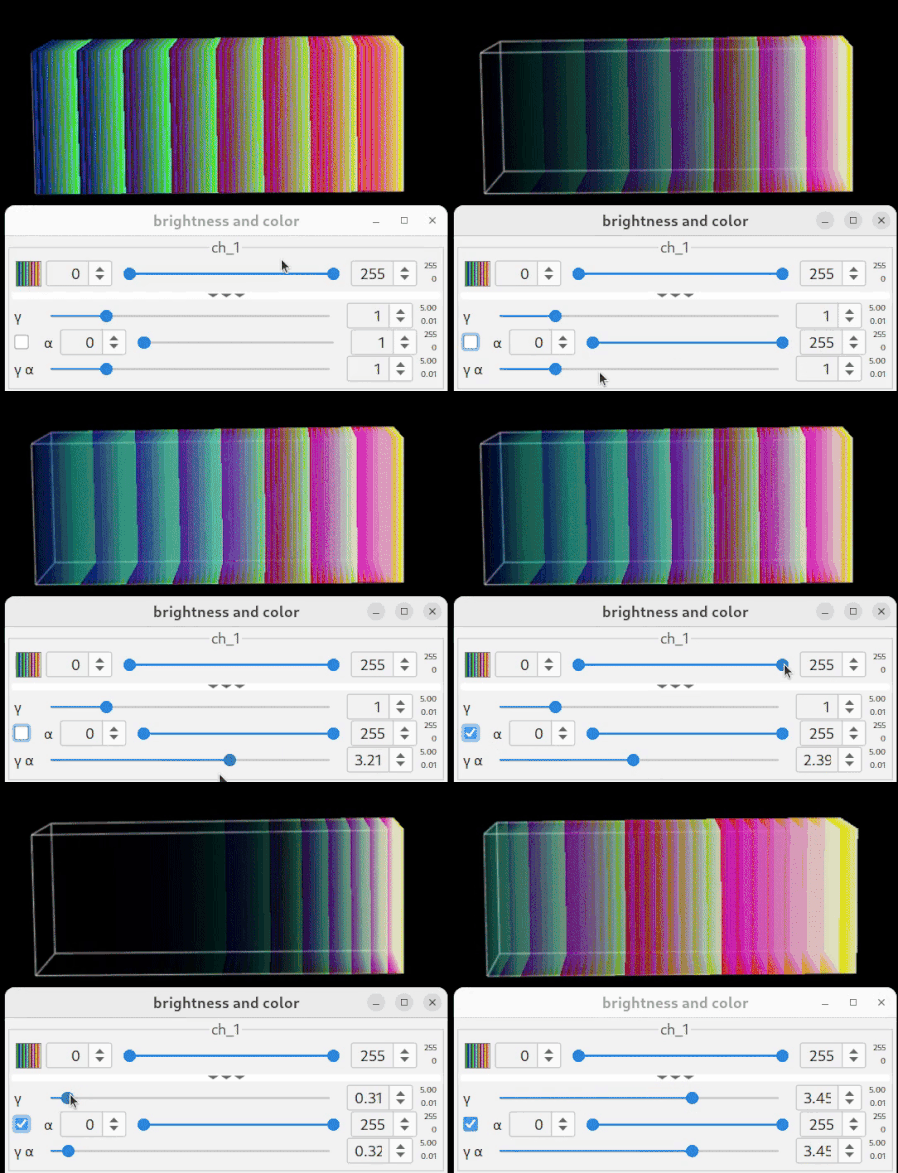
Notice, that in the first part of this example, when the alpha slider max is changed, the colors of the volume remain the same, only the voxels’ opacity is modified.
The last element in source appearance control is the checkbox on the left from the α slider. It is used to synchronize the top pair of sliders (color/LUT and γ) with the bottom pair (α and γ α), but not the other way around. It also synchronizes slider ranges. You can see its effect in the final part of the animation.
In “real life examples”, upon opening a data/volume, it is usually convenient to first keep this checkbox selected, to see the loaded volume and approximate data’s range. Later, fine-tune the alpha range independently (checkbox unselected) for a better visualization result.
Viewing annotations/segmentation results
3D annotations/segmentation results usually are represented as volumetric data, where all voxels corresponding to a specific segmentation object are marked with the same value.
Upon loading this type of data to BVV, MoBIE calculates and assigns a special lookup table to this source. In this LUT the color for the value of the object (voxel values) is the same as in the table containing annotations.
Therefore it is not recommended to change the brightness slider or its gamma value, since the order of annotation coloring will be broken.
By default MoBIE adjusts the alpha value to the range of [0,1] for this kind of data, so all annotations are not transparent. This kind of data is better displayed using “volumetric” rendering mode.
While exploring individual labels, setting “Opacity of non-selected labels” parameter to zero in the “Configure Label Rendering” dialog improved 3D view, making it less crowded.
Working with annotation results stored as a multi-scale pyramid can introduce some intermittent coloring blurring artifacts, see below.

This happens, because the voxels at the objects’ boundaries in the downscaled versions take intermediate values. Their appearance is more prominent in 3D view, but it disappears upon loading of the highest resolution level.
To speed up the loading, it is recommended to increase “GPU cache size” and “Render width and height” settings of BVV (see next section).
At the current moment MoBIE support maximum of 65535 labels per volume.
BigVolumeViewer settings
To change global BVV settings, right-click on the BigDataViewer window and select “Configure BigVolumeViewer Rendering”.
Short parameters description (and a bit longer, if interested) :
- Render width and height - the true quality of 3D rendering performed by GPU and stretched to the current window size. Increasing them makes a better picture at the expense of a higher computational load;
- Dither window size and number of dither samples. Interpolating nearby pixels (within the window) instead of sampling the volume. Increasing these values will speed up rendering at the expense of quality;
- GPU cache tile size size of the 3D blocks (in pixels) that are loaded to GPU;
- GPU cache size (in MB) limits the storage of the data in GPU memory. Increasing this parameter speeds up data display (should be less than your available GPU memory).
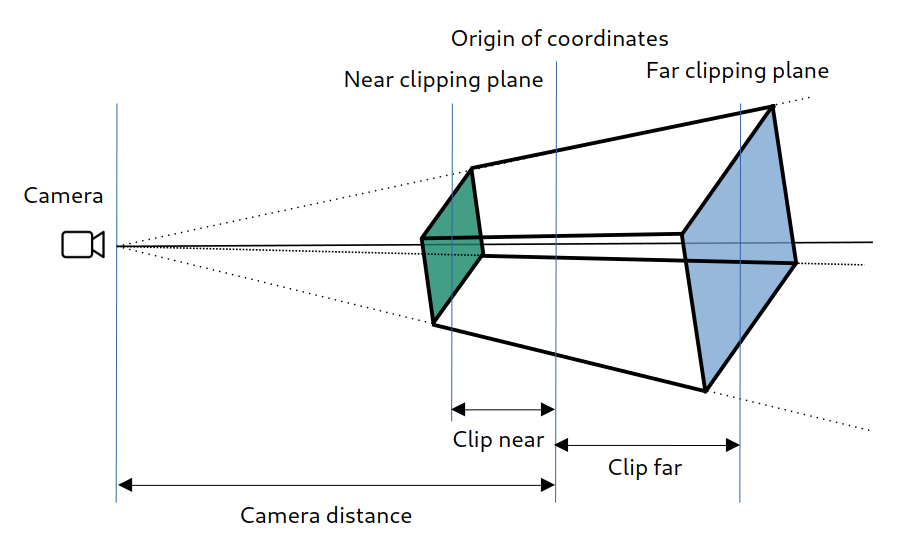
- Camera distance, Clip distance far/near parameters define viewing frustum of the perspective virtual camera. See the picture below to get an idea. “Camera distance” should be always larger than “clip distance near”. If you want to get the “BDV slice” view, you can set the “clip distance near” to zero.
