MoBIE
MultiModal Big Image Data Sharing and Exploration
3D light microscopy timeseries
Light-microscopy images or volumes taken over time are commonly used to study dynamical problems, for example in developmental biogly. Here we showcase the arabidopsis-root-lm-project that visualizes a timeseries of a growing Arabidopsis thaliana root imaged with lightsheet microscopy. For this example there is also a video tutorial that highlights MoBIE’s key features for visualizing timeseries.
Data & project set-up
The data for this project comes from the publication Accurate and versatile 3D segmentation of plant tissues at cellular resolution. It contains a timeseries of lightsheet volumes with a cell membrane and nucleus channel, as well as a derived cell segmentation and lineage tracking for selected cells. The cell segmentaiton was produced with PlantSeg, the tracking with MaMuT.
The data from the original publication was converted to the MoBIE data format using the MoBIE python library, which is called in this script. The project metadata is stored on github and the image data is stored on the EMBL S3 server.
Exploring the project
One of the most common ways to analyze timeseries data is to track cells over time, for example to study developing organisms on a cellular level. Here we demonstrate how cell tracking results can be visualized in MoBIE.
Open the project from https://github.com/mobie/arabidopsis-root-lm-project. See “Getting Started” for how to open a project in the MoBIE Fiji plugin.
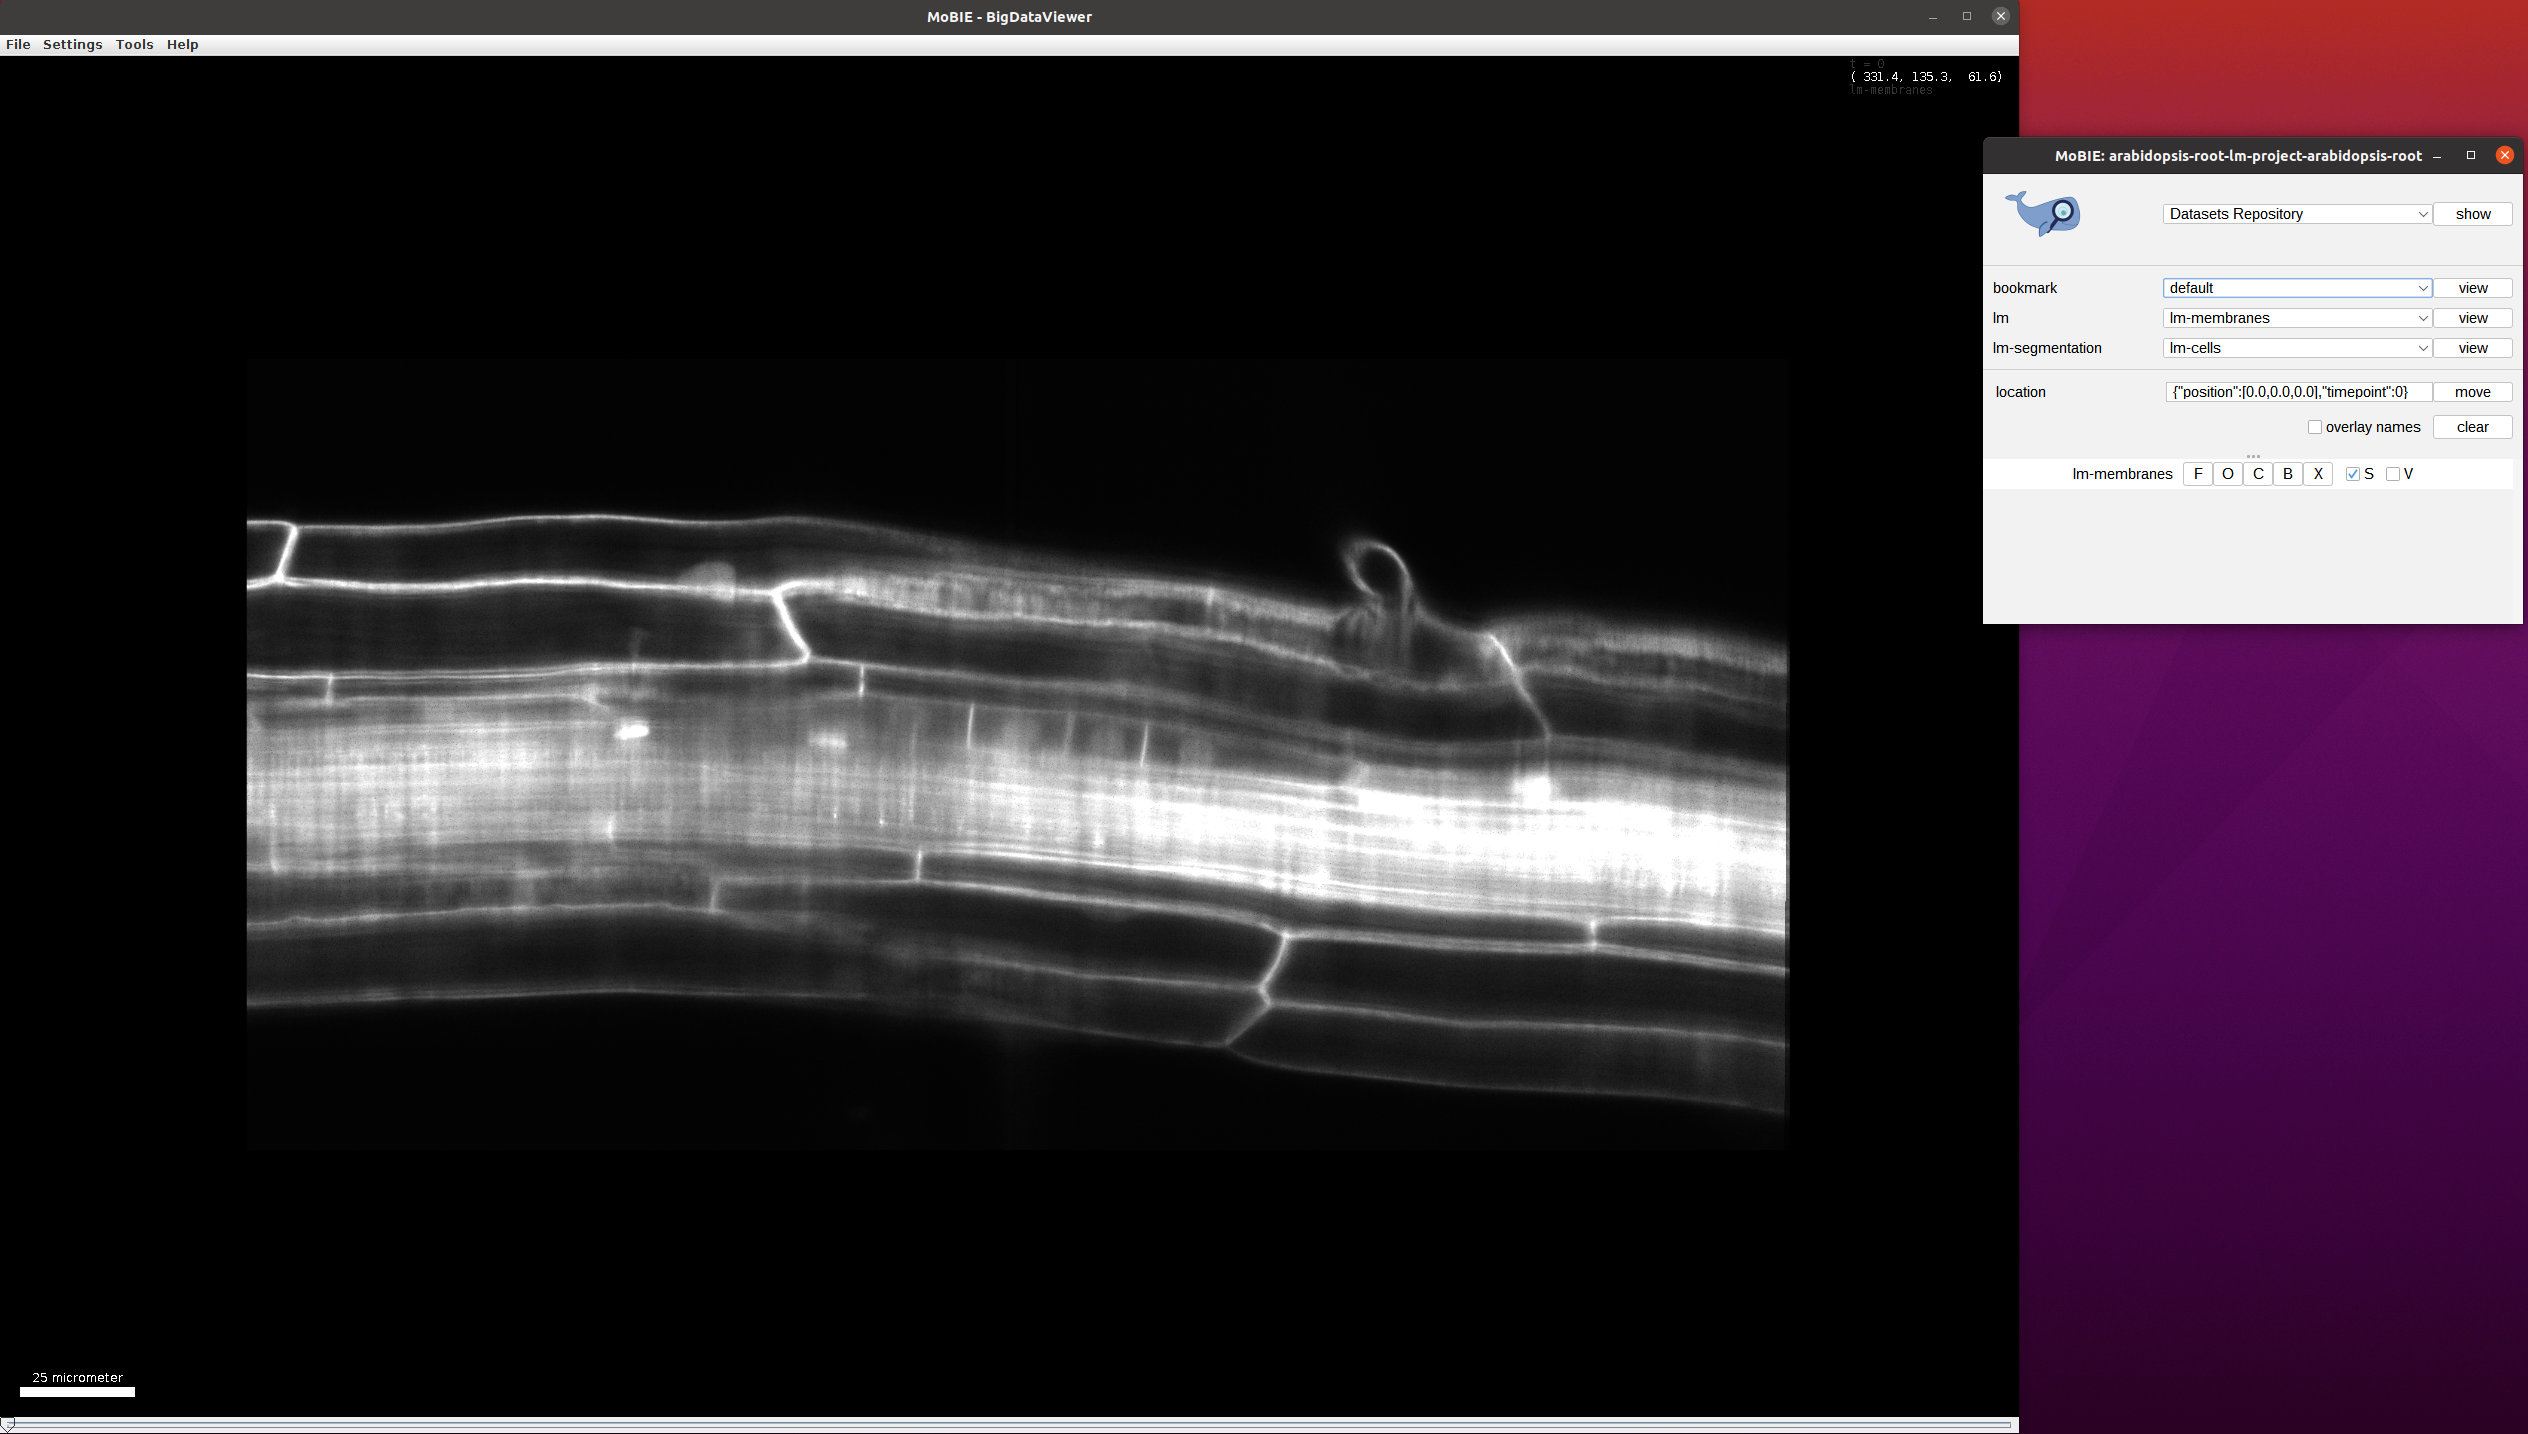
The project will open to the default view, which shows the middle of the volume at timepoint 0:
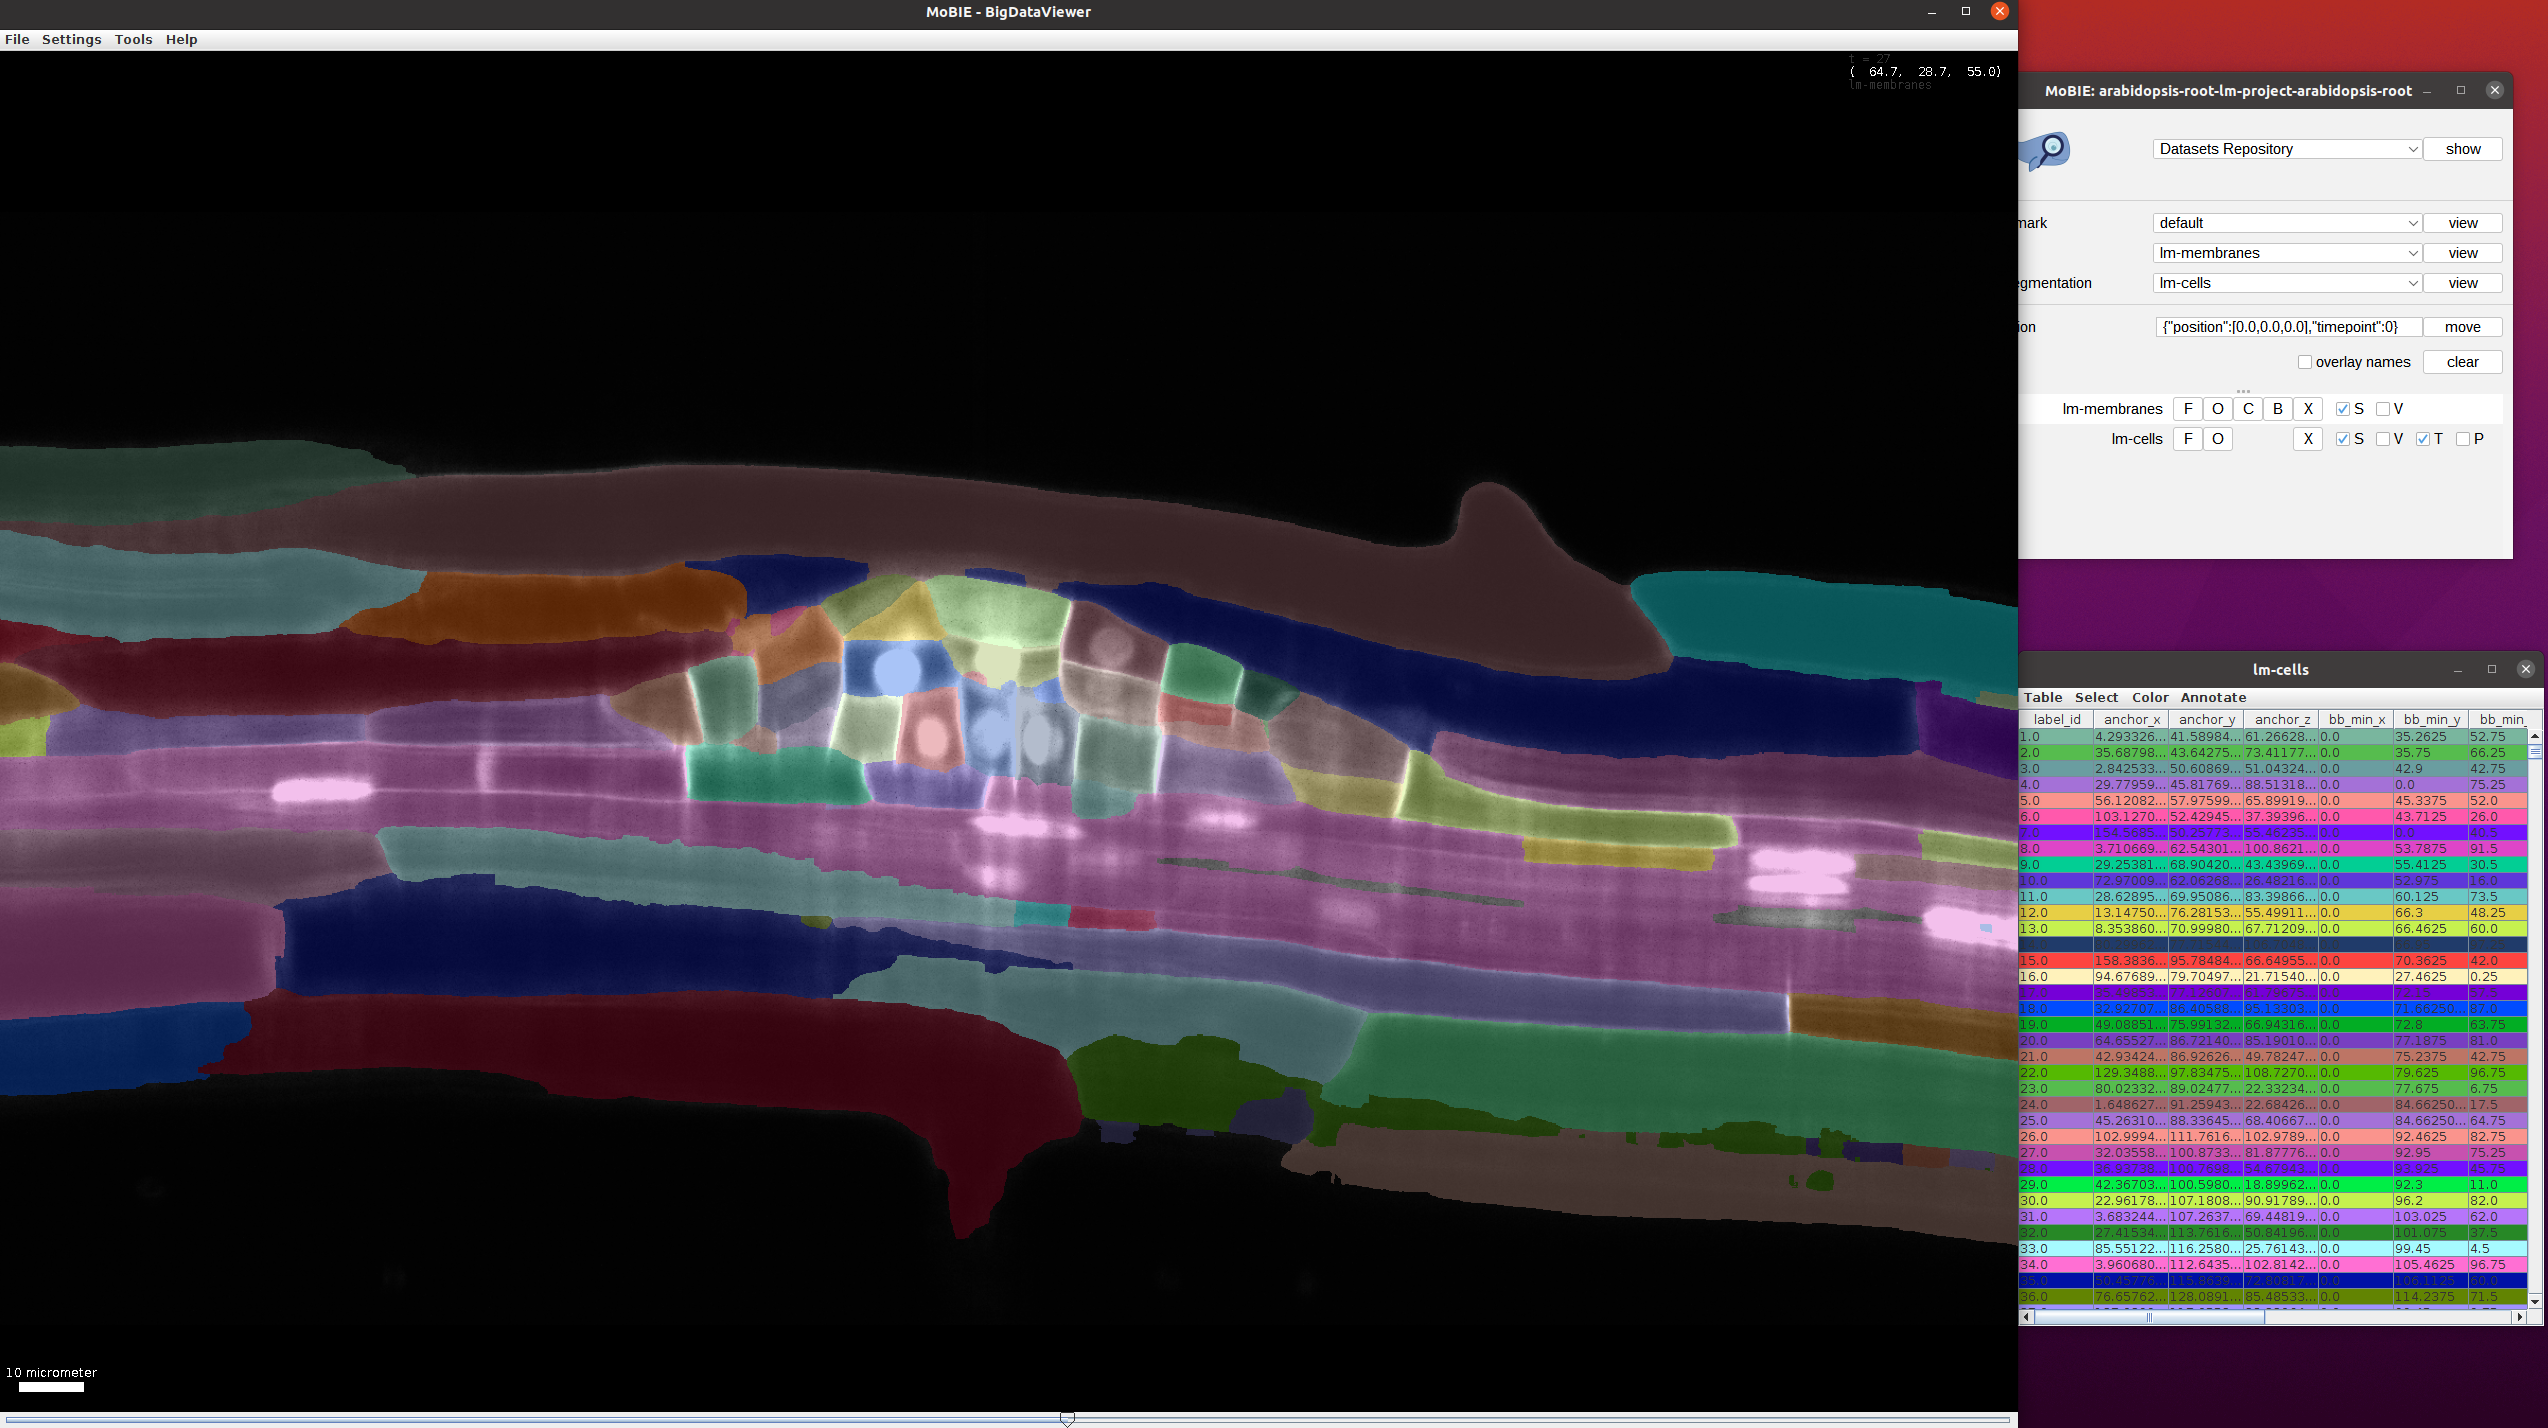
Add the cell segmentation to the viewer (lm-segmentation->lm-cells->view).
Use the scrollbar (bottom) to move through time and go to a timepoint where the primordial root (smaller cells in the middle) is visible:
This view can be loaded in MoBIE via bookmarks->use-case1->view.
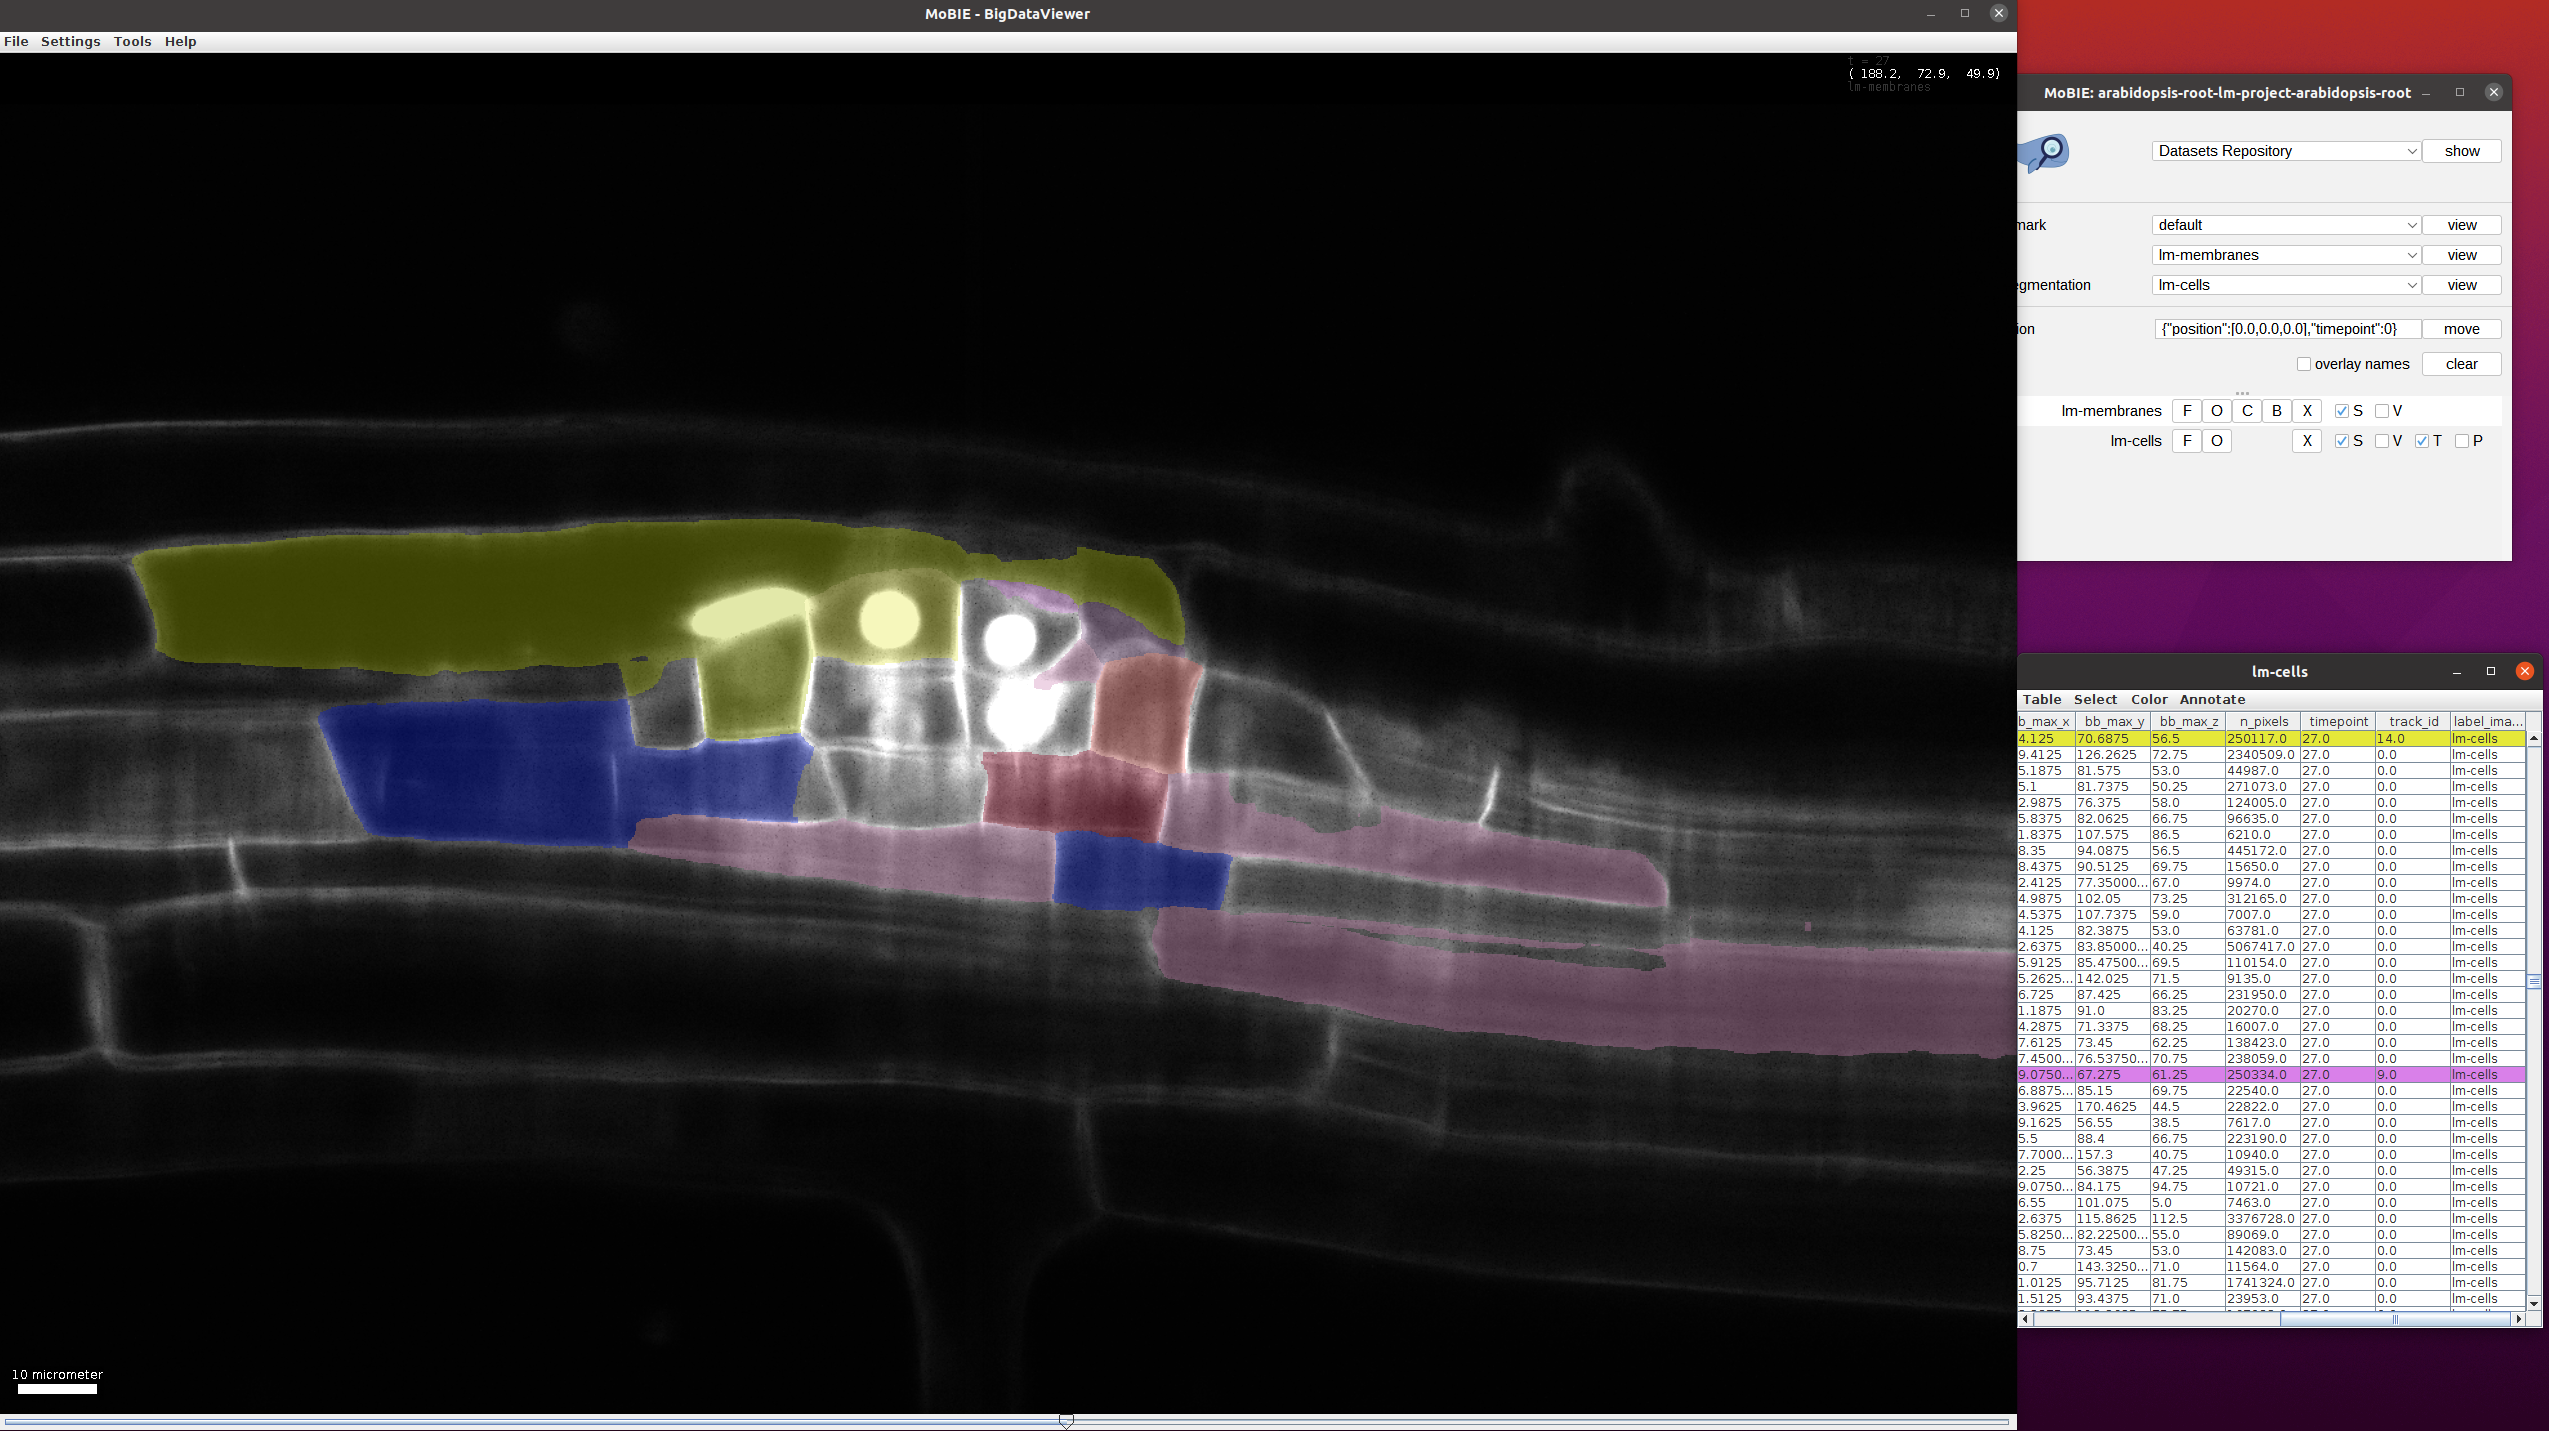
Find the cells which have beent tracked. For this, select Color->Color by Column in the lm-cells table and then select Column:track_id, Coloring Mode: glasbey, Paint Zero Transparent in the following menu. After this, only the cells with tracks will be highlighted in the image and table and their color will change based on the track_id:
This view can be loaded in MoBIE via bookmarks->use-case2->view.
Choose a track_id that you want to follow through time (e.g. by selecting a cell in the image and reading the corresponding track_id from the table).
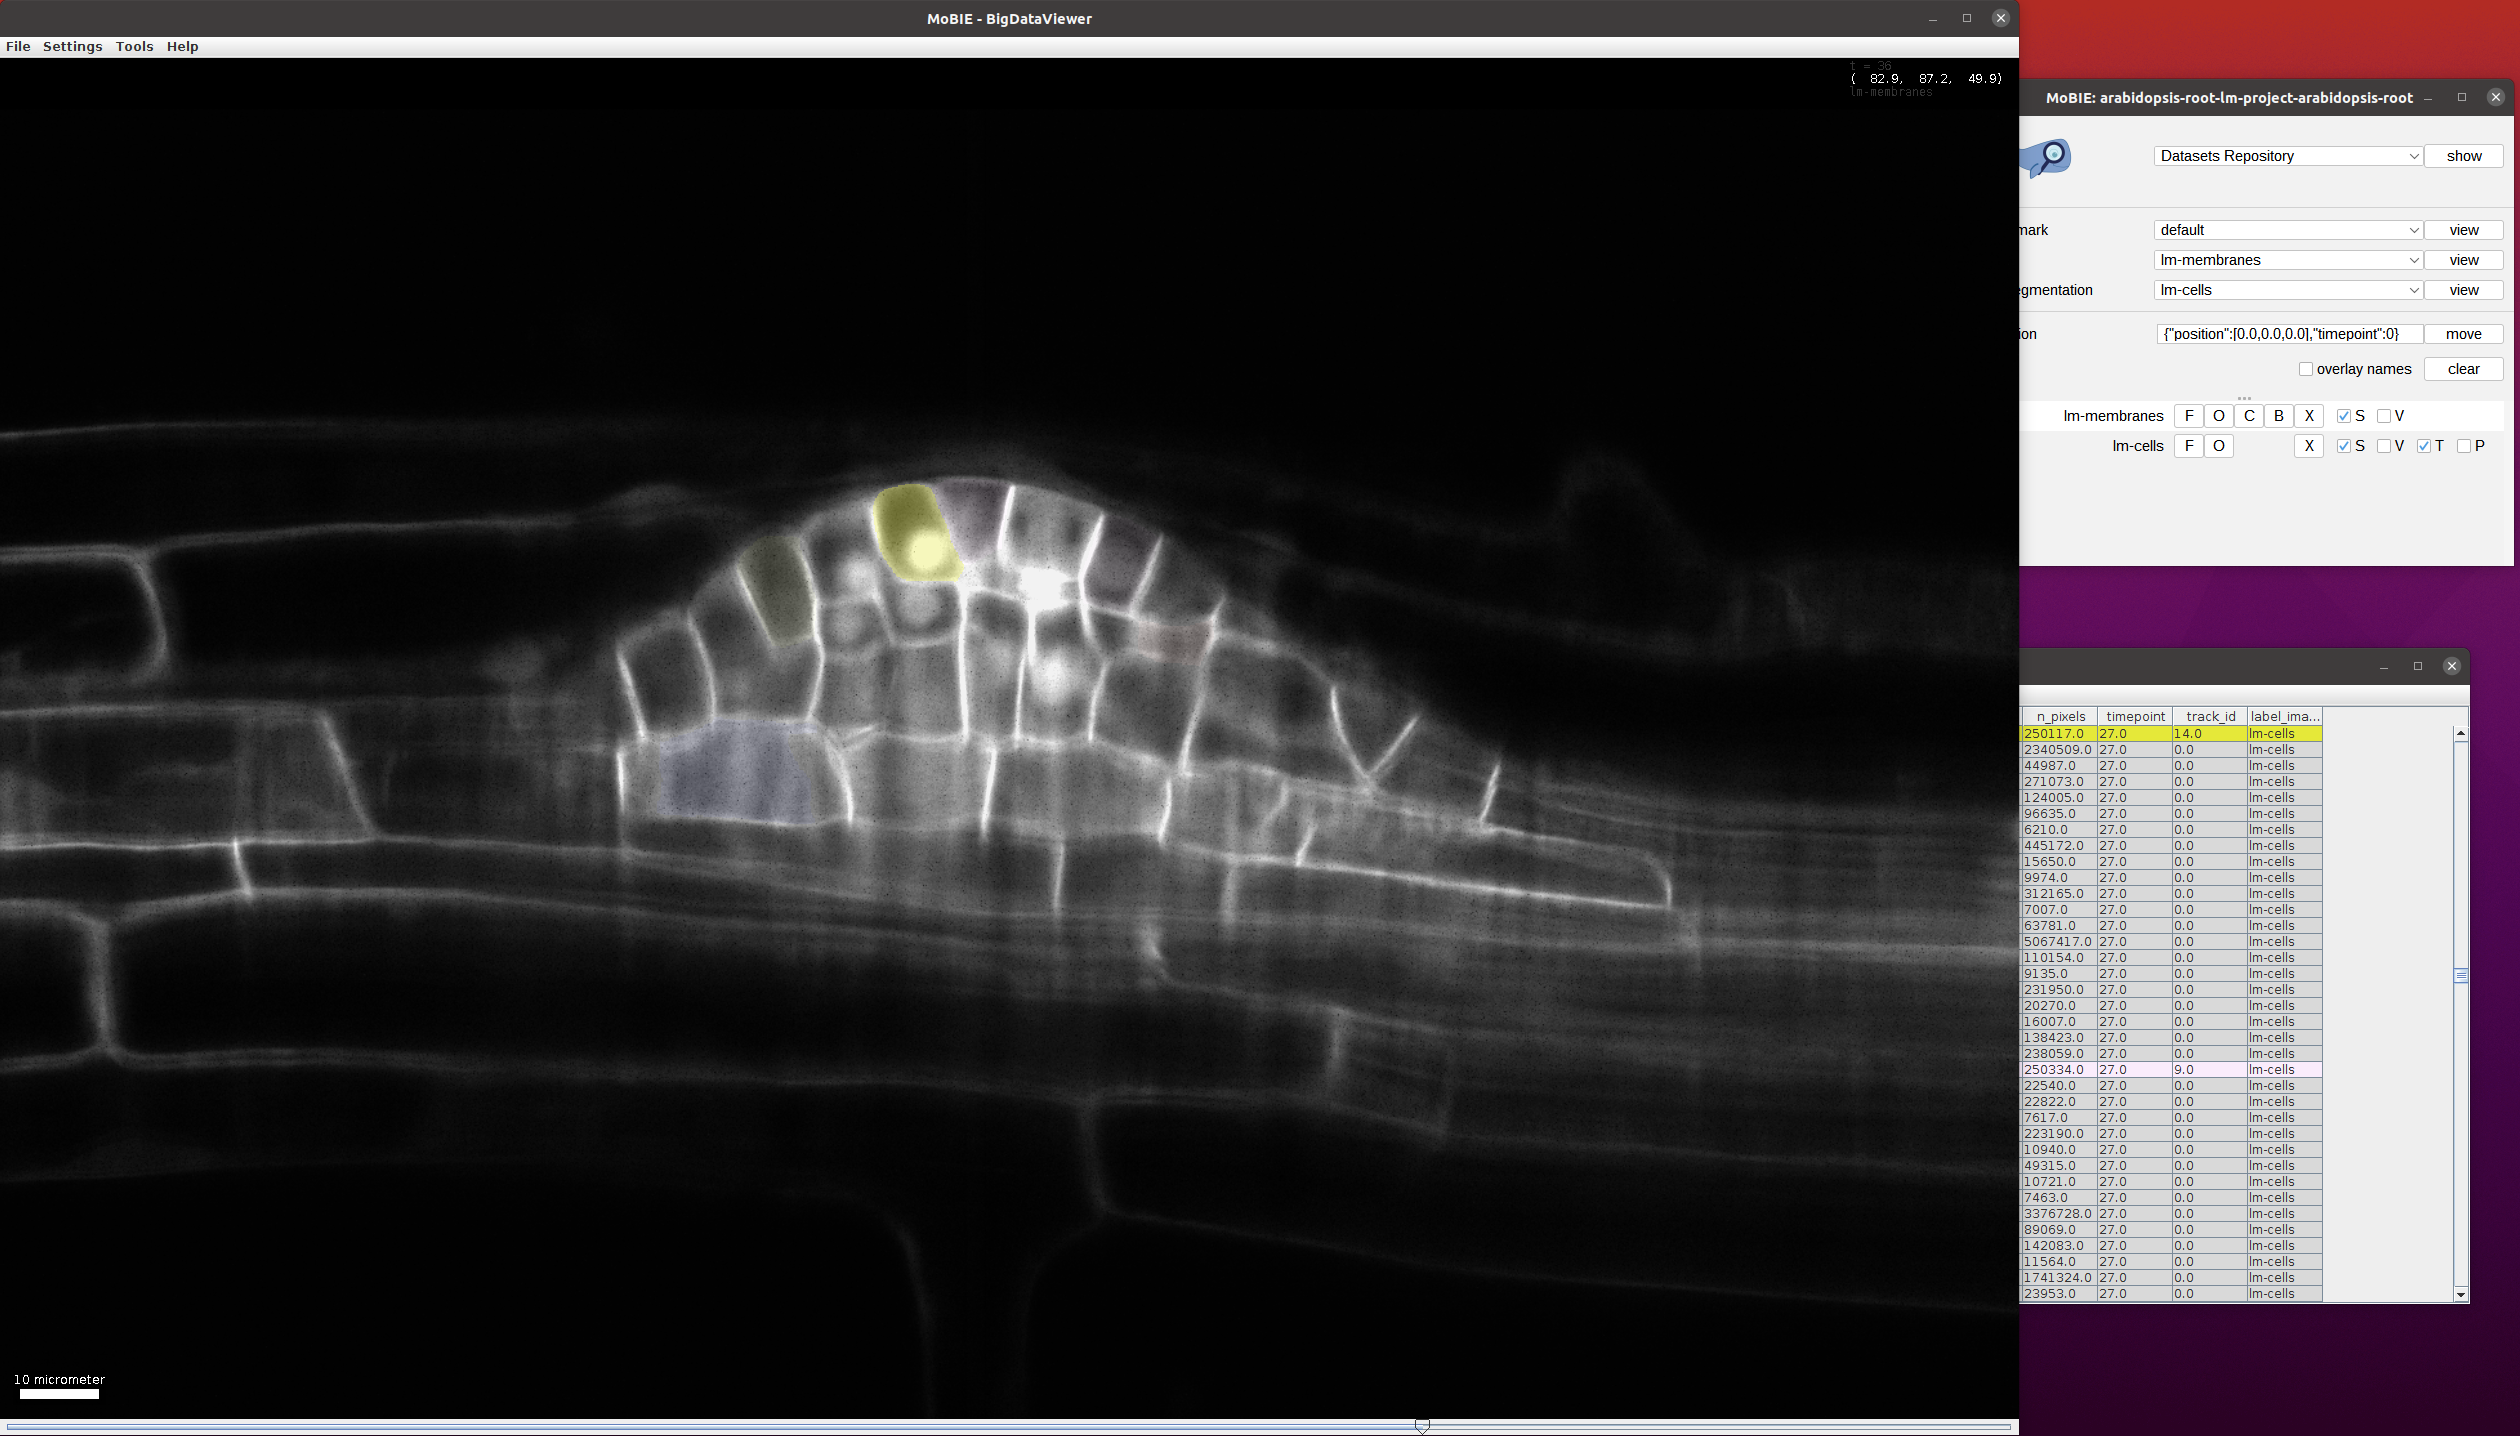
To easily follow a given track through time you can select all cells with a given track_id by clicking Select->Select Equal To ... in the table menu.
In the following menu enter Column:track_id and value:14 (here 14 is just an example track_id, you can choose another one to follow a different track).
This will select all cells through time with that track_id: when scrolling through time you will see that the cells along the given track are selected:
This view can be loaded in MoBIE via bookmarks->use-case3->view.