MoBIE
MultiModal Big Image Data Sharing and Exploration
MoBIE specification
MoBIE projects follow the specification described here; it is based on four key concepts:
- A
project, which groups data, for example from the same publication, that can be opened by the MoBIE viewer. It consists of multipledatasets. - A
dataset, which contains all the data that can be opened in the same MoBIE viewer instance. - A
source, which corresponds to the data for a single image (also volume, timeseries), segmentation image or spot coordinates. For segmentation images it may also contain the associated tabular data. For spots the only data associated with the source is a table. - A
view, which describes the full viewer state.
The specification is defined via jsonschema. The schema files are located here.
It is versioned, following the semantic versioning convention. The current version is 0.3.0.
Using jsonschema:
The jsonschema files can be used in the following ways:
- Static validation against the schema: using e.g. jsonschema-python
jsonschema -i my-dataset-schema.json schema/dataset.schema.json. See also the full project validation script. - Generate example data from the schema with fake-schema-cli:
fake-schema schema/dataset.schema.json
Project
The project and its associated datasets are stored in a directory structure, with the project corresponding to the root directory.
This directory must contain the file project.json, which must contain a valid project schema.
See an example project structure, slightly adapted from the clem project:
clem/
├── project.json
├── hela
└── yeast
Project Metadata
The project metadata, stored in project.json, has the following structure:
datasets: List of the available datasets. The dataset directory names must match the names in this list. It must contain at least one dataset.defaultDataset: The dataset that will be opened when the MoBIE viewer is started for this project.description: Description of this project.references: List of references (publications, urls etc.) for this project.specVersion: The MoBIE specification version of this project.
For the clem project the project.json looks like this:
{
  "datasets": ["hela", "yeast"],
  "defaultDataset": "hela",
  "description": "Correlative electron microscopy data from the Schwab Lab at EMBL Heidelberg.",
  "references": ["https://doi.org/10.1083/jcb.201009037", "https://doi.org/10.1038/nmeth.1486"],
  "specVersion": "0.3.0"
}
Local & Remote Projects
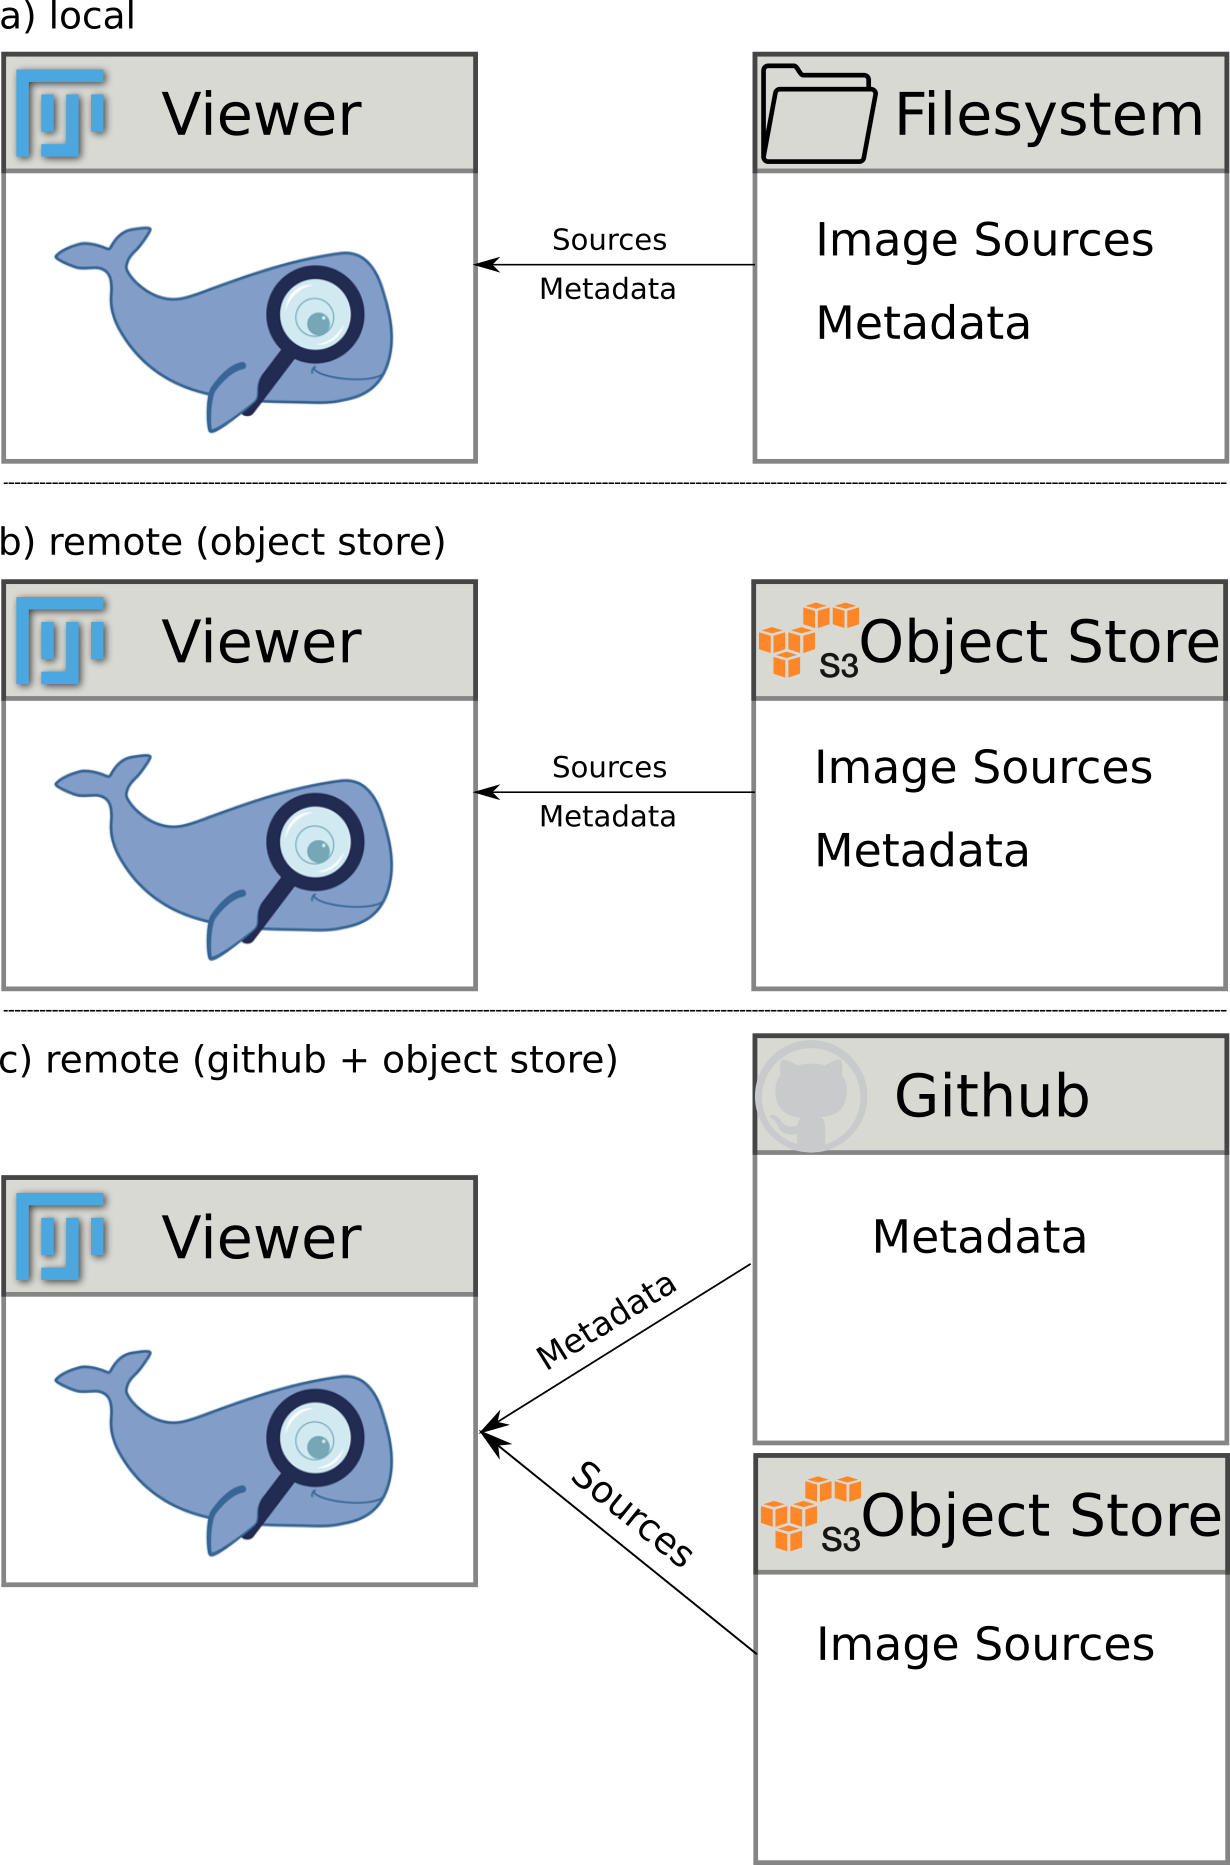
Projects can be stored locally or hosted remotely and the image data, i.e. the images in one of the supported data formats and metadata, i.e. the json files describing the project and tabular data can be accessed from different storage locations for one project.
In more detail, MoBIE currently supports the following three storage options:
- filesystem: can store
image dataandmetadata. - s3 object storage: can store
image dataandmetadata; public and private buckets are supported. - github: can only store
metadata,image datamust be loaded from object storarge.
This enables different combinations of hosting a project, see also this figure:
- only on filesystem: project is only available locally.
- only on s3 object storage: project is self-contained in object storage and can be shared with collaborators privately (using a privat bucket) or shared publicly (using a public bucket).
- on github and s3 object storage: the metadata is stored on github, which also serves as entrypoint for the viewer. The image data is stored on the s3 bucket. This set-up has the advantage that the metadata is under version control.
Dataset
A dataset consists of a root directory, which must contain the file dataset.json with a valid dataset schema.
It should contain the subdirectories images, containing the image data, tables, containing the table data and may contain the directory misc, containing additional data associated with this dataset.
Note that the location of image and table data is determined in dataset.json and it is thus possible to choose a different directory structure than images/ and tables/ to store them,
but the layout using images/ and tables/ is recommended for consistency with other MoBIE projects and assumed throughout this document.
The images directory contains the metadata files describing the image data, see data specification for details.
It may contain additional subdirectories to organise these files. By convention the files for different data formats are often separated into folders named accordingly, e.g. images/bdv-n5 and images/bdv-n5-s3.
The tables directory contains all tabular data assoicated with segmentation, spot or region sources (see the data specification for details)
The tables associated with a segmentation or view, must all be located in the same subdirectory. This subdirectory must contain a default table, which should be called default.tsv, and may contain additional tables.
See the table data specification for details on how tables are stored.
The misc directory may contain the subdirectory views with additional views stored in json files according to the views spec.
As an example see the dataset directory structure for the hela dataset of the clem project:
hela/
├── dataset.json
├── images
│   ├── bdv-n5
│   └── bdv-n5-s3
├── misc
│   └── views
└── tables
    ├── em-crop
    └── lm-tomogram-table
Dataset Metadata
The dataset metadata, stored in dataset.json, has the following structure:
defaultLocation: Default location used to initialize thelocationGUI element of the MoBIE menu.description: Description of this dataset.is2d: Are all images in this dataset two dimensional?sources: Mapping source names to their specification.views: Mapping of view names for to their specification. Must contain thedefaultview.
For example, the dataset.json file for the hela dataset looks like this (source and view metadata omitted for brevity):
{
    "defaultLocation": {...}
    "description": "A correlative electron microscopy sample of a HeLa cell.",
    "is2d": false,
    "sources": {
        "em-detail-a1-A": {...},
        "em-detail-a2-A": {...},
        ...
    },
    "views": {
        "default": {...},
        ...
    }
}
Source
A source consists of an image (volume, timeseries) and optionally associated tabular data.
Two different types of sources are supported:
image: intensity images corresponding to the “primary” data, e.g. electron microscopy or light microscopy images.regions: annotations for regions in the image (e.g. positions in a grid view). For reference inregionDisplays, see this section for details.segmentation: label masks corresponding to segmented objects labeled by integer ids, e.g. cell or ultrastructure segmentations.spots: point-like data, corresponding to a table with spot coordinates and associated measurements. For example gene detections in spatial transcriptomics.
Image Data
The data is stored in a chunked format for multi-dimensional data. Currently MoBIE supports the following data formats:
bdv.n5andbdv.n5.s3: the data is stored in the n5 data format. The bdv n5 format is used to store additional metadata about timepoints, the multi-scale image pyramid and transformations. To support data stored on s3, we extend the xml by custom fields that describe the s3 storage. See an example here.bdv.hdf5: the data is stored in the HDF5 data format, using the bdv hdf5 format to represent image metadata. This format can only be read locally and does not support remote access from an object store.ome.zarrandome.zarr.s3: the data is stored in the ome zarr file format, which contains all relevant metadata about transformations and the multi-scale image pyramid in the zarr file directly.openOrganelle.s3: the data is stored in the open organelle data format, which is based on n5. Currently, this data format can only be streamed from s3 and cannnot be opened locally. We have added it to support data made available throuhg the Open Organelle data platform and the support is still experimental.
For the data formats using a BigDataViewer xml file, each xml file must only contain a single setup id and the value of the field name must be the same as the name in the source metadata.
Similarly, for data stored in ome.zarr, the value of the name field in the image metadata must correspond to the name of the source.
Table Data
MoBIE supports tables associated with segmentations, where each row corresponds to properties of an object in the segmentation.
The tables should be stored as tab separated values .tsv files; they may also be stored as comma separated values (.csv).
The default segmentation table (which must be stored as default.tsv in the corresponding table folder, see also dataset specification) must contain the columns label_id, anchor_x, anchor_y, anchor_z,
bb_min_x, bb_min_y, bb_min_z and bb_min_x, bb_min_y, bb_min_z. For two-dimension data the columns anchor_z, bb_min_z and bb_max_z must be omitted. The anchor columns specify a reference point for the object corresponding to this row. It will be centered
when the corresponding obejct is selected. The bb_min and bb_max columns specify the start and stop of the bounding box for the object. Both anchor and bounding box coordinates must
be given in phyisical units. The table may contain additional columns.
Additional segmentation tables must contain the column label_id and may contain arbitraty additional columns.
The label_ids in the additional tables may be incomplete, but they must not contain ids not present in the default table.
For example, given label_ids [1, 2, 3, 4, 5] in the default table the label_ids [1, 2, 3, 4, 5] or [1, 3, 4] are valid but [1, 3, 4, 7] is invalid.
The label id 0 is reserved for the background and must not be listed in any of the tables.
See an example segmentation default table for 2d data for 8 objects:
label_id    anchor_x    anchor_y    bb_min_x    bb_min_y    bb_max_x    bb_max_y
1.0 49.78   41.25   8.7 45.23   3.36    56.053  44.24
2.0 42.79   40.06   9.0 38.29   3.81    48.513  43.55
3.0 52.79   44.33   9.9 48.41   3.81    56.946  47.02
4.0 57.90   42.95   7.8 53.77   3.59    62.204  45.63
5.0 47.19   45.17   9.8 43.45   4.49    51.490  47.91
6.0 40.31   41.75   9.9 37.00   4.71    46.430  44.84
7.0 64.68   43.91   8.4 60.12   4.71    70.439  46.72
8.0 35.57   43.39   10. 30.55   4.93    40.676  46.03
The color scheme used to display the segmentation can also be loaded from a table, see colorByColumn in the view metadata. In order to set an explicit color map, the field color may be set to argbColumn. In this case, the values in the column must follow the format alpha-red-green-blue, e.g. 255-0-0-255.
Data for a spot source is defined by a table. This table must contain the column spot_id, which identifies each spot in the image. It must also contain the columns x, y and z (z is omitted in the case of 2d data). These three columns give the coordinates for each spot in the physical coordinate space. Otherwise the spot tables follow the same rules as segmentation tables.
Region tables also have an associated table. It is described in further detail here
Source Metadata
The metadata for the sources of a dataset is specified in the field sources of dataset.json (see also dataset metadata).
sources contains a mapping of source names to source metadata.
The source metadata has the following elements (see below for an example json):
image: An image source. The source name (=key for this source entry) must be the same as the setup name in the bdv.xml. The fieldimageDatais required.description: Description of this image source.imageData: Description of the image data for this source, including the file format and the location of the data.bdv.hdf5: Data stored in the bdv.hdf5 format, i.e. hdf5 data that is stored on the local fileystem. The fieldrelativePathis required.relativePath: The file path to the xml storing the bdv metadata, relative to the dataset root location.
bdv.n5: Data stored in the bdv.n5 format, i.e. n5 data that is stored on the local fileystem. The fieldrelativePathis required.relativePath: The file path to the xml storing the bdv metadata, relative to the dataset root location.
bdv.n5.s3: Data stored in the bdv.n5.s3 format, i.e. n5 data that is stored on a s3 object store. The fieldrelativePathis required.relativePath: The file path to the xml storing the bdv metadata, relative to the dataset root location.
bdv.ome.zarr: Data stored in the bdv.ome.zarr format, i.e. ome.zarr data that is stored on the local fileystem with additional bdv xml metadata. The fieldrelativePathis required.relativePath: The file path to the xml storing the bdv metadata, relative to the dataset root location.
bdv.ome.zarr.s3: Data stored in the bdv.ome.zarr.s3 format, i.e. ome.zarr data that is stored on a s3 object store with additional bdv xml metadata. The fieldrelativePathis required.relativePath: The file path to the xml storing the bdv metadata, relative to the dataset root location.
ome.zarr: Data stored in the ome.zarr format, i.e. ome.zarr data that is stored on the local fileystem. The fieldrelativePathis required.channel: Optional channel to display from the ome.zarr file, in case it contains multiple channels.relativePath: The file path to the ome.zarr file, relative to the dataset root location.
ome.zarr.s3: Data stored in the ome.zarr.s3 format, i.e. ome.zarr data that is stored on a s3 object store. The fields3Addressis required.channel: Optional channel to display from the ome.zarr file, in case it contains multiple channels.s3Address: The s3 address for this image data.signingRegion: The signing region for aws, e.g. us-east-1.
openOrganelle.s3: Data stored in the openOrganelle file format on a s3 object store. The fields3Addressis required.s3Address: The s3 address for this image data.signingRegion: The signing region for aws, e.g. us-east-1.
segmentation: A segmentation source. The source name (=key for this source entry) must be the same as the setup name in the bdv.xml. The fieldimageDatais required.description: Description of this segmentation source.imageData: Description of the image data for this source, including the file format and the location of the data.bdv.hdf5: Data stored in the bdv.hdf5 format, i.e. hdf5 data that is stored on the local fileystem. The fieldrelativePathis required.relativePath: The file path to the xml storing the bdv metadata, relative to the dataset root location.
bdv.n5: Data stored in the bdv.n5 format, i.e. n5 data that is stored on the local fileystem. The fieldrelativePathis required.relativePath: The file path to the xml storing the bdv metadata, relative to the dataset root location.
bdv.n5.s3: Data stored in the bdv.n5.s3 format, i.e. n5 data that is stored on a s3 object store. The fieldrelativePathis required.relativePath: The file path to the xml storing the bdv metadata, relative to the dataset root location.
bdv.ome.zarr: Data stored in the bdv.ome.zarr format, i.e. ome.zarr data that is stored on the local fileystem with additional bdv xml metadata. The fieldrelativePathis required.relativePath: The file path to the xml storing the bdv metadata, relative to the dataset root location.
bdv.ome.zarr.s3: Data stored in the bdv.ome.zarr.s3 format, i.e. ome.zarr data that is stored on a s3 object store with additional bdv xml metadata. The fieldrelativePathis required.relativePath: The file path to the xml storing the bdv metadata, relative to the dataset root location.
ome.zarr: Data stored in the ome.zarr format, i.e. ome.zarr data that is stored on the local fileystem. The fieldrelativePathis required.channel: Optional channel to display from the ome.zarr file, in case it contains multiple channels.relativePath: The file path to the ome.zarr file, relative to the dataset root location.
ome.zarr.s3: Data stored in the ome.zarr.s3 format, i.e. ome.zarr data that is stored on a s3 object store. The fields3Addressis required.channel: Optional channel to display from the ome.zarr file, in case it contains multiple channels.s3Address: The s3 address for this image data.signingRegion: The signing region for aws, e.g. us-east-1.
openOrganelle.s3: Data stored in the openOrganelle file format on a s3 object store. The fields3Addressis required.s3Address: The s3 address for this image data.signingRegion: The signing region for aws, e.g. us-east-1.
tableData: Description of the table data for this source, including the format and the location of the table data. The fieldtsvis required.tsv: Table data in tsv file format, specified as root location for the folder with tables. The folder MUST contain the table default.tsv, which will always be loaded as the first table for this source; this table MUST contain the mandatory columns for the given source type. The fieldrelativePathis required.relativePath: The relative path of the table data w.r.t the dataset root location.
spots: A spot source, corresponding to a collection of points loaded from a table. The table must contain the columns ‘spot_id’, as well as ‘x’, ‘y’, ‘z’ (‘z’ is not required for 2d datasets.). The fieldstableData,boundingBoxMin,boundingBoxMaxandunitare required.boundingBoxMax: The maximum of the bounding box of physical cooridinates for the spots. Contains a list of numbers.boundingBoxMin: The minimum of the bounding box of physical cooridinates for the spots. Contains a list of numbers.description: Description of this spot source.tableData: Description of the table data for this source, including the format and the location of the table data. The fieldtsvis required.tsv: Table data in tsv file format, specified as root location for the folder with tables. The folder MUST contain the table default.tsv, which will always be loaded as the first table for this source; this table MUST contain the mandatory columns for the given source type. The fieldrelativePathis required.relativePath: The relative path of the table data w.r.t the dataset root location.
unit: The unit of measurement for the coordinate system, e.g. micrometer or nanometer.
regions: A region table, corresponding to a image region attributes. The table must contain the column ‘region_id’. Can be referenced in regionDisplays. The fieldtableDatais required.description: Description of the region table.tableData: Description of the table data for this source, including the format and the location of the table data. The fieldtsvis required.tsv: Table data in tsv file format, specified as root location for the folder with tables. The folder MUST contain the table default.tsv, which will always be loaded as the first table for this source; this table MUST contain the mandatory columns for the given source type. The fieldrelativePathis required.relativePath: The relative path of the table data w.r.t the dataset root location.
Examples:
{
  "em-detail-a1-A": {
    "image": {
      "imageData": {
        "bdv.n5": {
          "relativePath": "images/bdv-n5/em-detail-a1-A.xml"
        },
        "bdv.n5.s3": {
          "relativePath": "images/bdv-n5-s3/em-detail-a1-A.xml"
        }
      }
    }
  }
}
{
  "em-segmentation": {
    "segmentation": {
      "imageData": {
        "bdv.n5": {
          "relativePath": "images/local/em-segmentation.xml"
        },
        "bdv.n5.s3": {
          "relativePath": "images/remote/em-segmentation.xml"
        }
      },
      "tableData": {
        "tsv": {
          "relativePath": "tables/em-segmentation"
        }
      }
    }
  }
}
View
A view stores all metadata necessary to fully reproduce the MoBIE viewer state.
Region Displays
Views may contain region displays, specified by a regionDisplay (see schema description below), which describe the physical locations of images or collection of images in the global coordinate system.
Region displays must contain a reference to a region source.
The region source is associated with a table, which has rows associated with the regions. This table can be used in the viewer to navigate to the corresponding region (by clicking on the row) and may store additional annotations or measurements.
The table must contain the column region_id and must contain at least one more column.
The values in the region_id column must be strings and must correspond to the keys of the sources field of the regionDisplay.
The sources field in the dispalay defines the mapping of the region_id values to the source(s) for each region.
Otherwise the same rules as outlined in the Table Data setion apply.
A primary application of region displays are tables for views with a grid transform (see schema description below).
See an example grid view table for four positions in a grid of tomograms for the clem project, which contains indicator values for the presence of different organelles for each position.
region_id    mitochondria    vesicles    golgi   er
source1   1   0   1   0
source2   1   0   1   1
source3   0   0   0   1
source4   0   1   0   1
View Metadata
The metadata for the views of a dataset is specified in the field views of dataset.json (see also dataset metadata).
views contains a mapping of view names to view metadata.
Additional views can be stored as json files with the field views mapping view names to metadata in the folder misc/views
The view metadata has the following elements (see below for an example json file):
description: Free text description of this view.isExclusive: Does this view replace the current viewer state (exclusive) or is it added to it (additive)?.sourceDisplays: The display groups of this view. Contains a list with items:imageDisplay: Viewer state for a group of image sources. The fieldscolor,contrastLimits,opacity,nameandsourcesare required.blendingMode: The blending mode for rendeting multiple image sources on top of each other. Use ‘sum’ for additive blending and ‘alpha’ for occluded blending. If not specified ‘sum’ will be used.color: The color map.contrastLimits: The contrast limits. Contains a tuple of [number, number].name: Name of this image display.opacity: The alpha value used for blending segmentation and image data in the viewer.resolution3dView: The resolution used for the 3d viewer, in physical units. Only relevant if ‘showImageIn3d’ is true. Will be determined automatically if not specified. Contains a list of numbers.showImagesIn3d: Whether to show the images in the 3d viewer.sources: The image sources that are part of this display group. Multiple sources should be moved apart spatially with source transform(s), e.g. grid, otherwise they will not be correctly displayed in the viewer. Contains a list of strings.visible: Are the sources of this display visible? Default is true.
segmentationDisplay: The fieldsopacity,lut,nameandsourcesare required.additionalTables: Additional tables to load for this display. This only needs to be specified if additional tables are loaded; the default table (default.tsv) will always be loaded. Contains a list with items:- Path to a csv table.
- Path to a tsv table.
boundaryThickness: Thickness of the boundary masks. Only used if showAsBoundaries is true.colorByColumn: Name of table column that is used for coloring. By default the ‘label_id’ column is used.lut: The look-up-table for categorical coloring modes. Note: if the lut is numeric (‘viridis’, ‘blueWhiteRed’), the valueLimits field must be given. ‘argbColumn’ is deprecated, please use ‘rgbaColumn’ instead.name: Name of this segmentation display.opacity: The alpha value used for blending segmentation and image data in the viewer.opacityNotSelected: The alpha value used for blending segmentation and image data in the viewer that is applied to segments that are not currently selected. By default this is set to 0.15.randomColorSeed: Random seed for the random color lut (e.g. glasbey) to reproduce the exact colors of the view. (Optional).resolution3dView: Resolution used for the 3d viewer, in physical units. Only relevant if ‘showSelectedSegmentsIn3d’ is true. Will be determined automatically if not specified. Contains a list of numbers.scatterPlotAxes: The names of columns which should be used for the scatter plot. Contains a list of strings.selectedSegmentIds: List of selected segment ids, each of the form sourceName;timePoint;label_id. Contains a list of strings.selectionColor: Color for the selected objects (segments, regions or spots). By default the color that follows from the current coloring scheme is used.showAsBoundaries: Show boundary mask instead of segment masks. Default is false.showScatterPlot: Whether to show the scatter plot. The default is ‘false’, i.e. if this property is not present the scatter plot should not be shown. If it is ‘true’ then ‘scatterPlotAxes’ must be given.showSelectedSegmentsIn3d: Whether to show the selected segments in the 3d viewer.showTable: Show the table GUI element. Default is true (if the display has a table).sources: The segmentation sources that are part of this display group. Multiple sources should be moved apart spatially with source transform(s), e.g. grid, otherwise they will not be correctly displayed in the viewer. Contains a list of strings.valueLimits: Value limits for numerical color maps: ‘blueWhiteRed’, ‘viridis’. Contains a tuple of [number, number].visible: Are the sources of this display visible? Default is true.
spotDisplay: The fieldsopacity,lut,nameandsourcesare required.additionalTables: Additional tables to load for this display. This only needs to be specified if additional tables are loaded; the default table (default.tsv) will always be loaded. Contains a list with items:- Path to a csv table.
- Path to a tsv table.
boundaryThickness: Thickness of the boundary masks. Only used if showAsBoundaries is true.colorByColumn: Name of table column that is used for coloring. By default the ‘label_id’ column is used.lut: The look-up-table for categorical coloring modes. Note: if the lut is numeric (‘viridis’, ‘blueWhiteRed’), the valueLimits field must be given. ‘argbColumn’ is deprecated, please use ‘rgbaColumn’ instead.name: Name of this spot display.opacity: The alpha value used for blending segmentation and image data in the viewer.opacityNotSelected: The alpha value used for blending segmentation and image data in the viewer that is applied to segments that are not currently selected. By default this is set to 0.15.randomColorSeed: Random seed for the random color lut (e.g. glasbey) to reproduce the exact colors of the view. (Optional).scatterPlotAxes: The names of columns which should be used for the scatter plot. Contains a list of strings.selectedSpotIds: List of selected segment ids, each of the form sourceName;timePoint;spot_id. Contains a list of strings.selectionColor: Color for the selected objects (segments, regions or spots). By default the color that follows from the current coloring scheme is used.showAsBoundaries: Show boundary mask instead of segment masks. Default is false.showScatterPlot: Whether to show the scatter plot. The default is ‘false’, i.e. if this property is not present the scatter plot should not be shown. If it is ‘true’ then ‘scatterPlotAxes’ must be given.showTable: Show the table GUI element. Default is true (if the display has a table).sources: The spot sources that are part of this display group. Contains a list of strings.spotRadius: The radius that is used for rendering the spots. In physical units.valueLimits: Value limits for numerical color maps: ‘blueWhiteRed’, ‘viridis’. Contains a tuple of [number, number].visible: Are the sources of this display visible? Default is true.
regionDisplay: The fieldssources,tableSource,opacity,lutandnameare required.additionalTables: Additional tables to load for this display. This only needs to be specified if additional tables are loaded; the default table (default.tsv) will always be loaded. Contains a list with items:- Path to a csv table.
- Path to a tsv table.
boundaryThickness: Thickness of the boundary masks. Only used if showAsBoundaries is true.colorByColumn: Name of table column that is used for coloring. By default the ‘region_id’ column is used.lut: The look-up-table for categorical coloring modes. Note: if the lut is numeric (‘viridis’, ‘blueWhiteRed’), the valueLimits field must be given. ‘argbColumn’ is deprecated, please use ‘rgbaColumn’ instead.name: Name for this field.opacity: The alpha value used for blending segmentation and image data in the viewer.opacityNotSelected: The alpha value used for blending segmentation and image data in the viewer that is applied to segments that are not currently selected. By default this is set to 0.15.randomColorSeed: Random seed for the random color lut (e.g. glasbey) to reproduce the exact colors of the view. (Optional).scatterPlotAxes: The names of columns which should be used for the scatter plot. Contains a list of strings.selectedRegionIds: List of selected source region ids, each of the form timePoint;region_id. Contains a list of strings.selectionColor: Color for the selected objects (segments, regions or spots). By default the color that follows from the current coloring scheme is used.showAsBoundaries: Show boundary mask instead of region masks. Default is false.showScatterPlot: Whether to show the scatter plot. The default is ‘false’, i.e. if this property is not present the scatter plot should not be shown.showTable: Show the table GUI element. Default is true.sources: Contains array with items of type NonetableSource: Name for this field.valueLimits: Value limits for numerical color maps: ‘blueWhiteRed’, ‘viridis’. Contains a tuple of [number, number].visible: Is the color overlay of this display visible? Default is true.
sourceTransforms: The source transformations of this view. The transformations must be defined in the physical coordinate space and are applied in addition to the transformations given in the bdv.xml. Contains a list with items:affine: Affine transformation applied to a list of sources. The fieldsparametersandsourcesare required.name: Name of this transformation.parameters: Parameters of the affine transformation, using the BigDataViewer convention. Contains a list of numbers.sourceNamesAfterTransform: Names of the sources after transformation. If given, must have the same number of elements assources. Contains a list of strings.sources: The sources this transformation is applied to. Contains a list of strings.timepoints: The valid timepoints for this transformation. If none is given, the transformation is valid for all timepoints. Contains a list of integers.
crop: Crop transformation applied to a list of sources. The fieldsmin,maxandsourcesare required.boxAffine: The transformation to place the crop’s bounding box in the global coordinate system (if not given assumes identity). Contains a list of numbers.centerAtOrigin: Whether to center the source at the coordinate space origin after applying the crop. By default true.max: Maximum coordinates for the crop. Contains a list of numbers.min: Minimum coordinates for the crop. Contains a list of numbers.name: Name of this transformation.rectify: Whether to align the crop’s bounding box with the coordinate system. By default true.sourceNamesAfterTransform: Names of the sources after transformation. If given, must have the same number of elements assources. Contains a list of strings.sources: The sources this transformation is applied to. Contains a list of strings.timepoints: The valid timepoints for this transformation. If none is given, the transformation is valid for all timepoints. Contains a list of integers.
mergedGrid: A grid view of multiple sources that creates an new merged source. Only valid if all sources have the same size (both in pixels and physical space). The fieldsmergedGridSourceNameandsourcesare required.mergedGridSourceName: Name for this field.metadataSource: Name of the source to be used as reference to load the metadata for all sources in this transformation. This can decrease the load time significantly for large grids. Note that the image related metadata (shape, datatype, etc.) must exactly match.positions: Grid positions for the sources. If not specified, the sources will be arranged in a square grid. If given, must have the same length assourcesand contain 2d grid positions specified as [y, x]. Contains a list of arrays.sources: The sources this transformation is applied to. After transformation all sources will get the name_ . still refers to the source befor transformation (useful e.g. for specifying a metadataSource). Contains a list of strings.
timepoints: Move sources to different timepoints. The fieldsparametersandsourcesare required.keep: Whether to keep timepoints that are not transformed, or to only display timepoints that are explicitly given in the transformation.name: Name of this transformation.parameters: List of the timepoint shifts. The list contains elements of size 2, the first entry gives the new timepoint (where the source is moved to), the second the old one (where it comes from). The first entries must be unique across the whole list, the second entries may be duplicated. Contains a list of arrays.sources: The sources this transformation is applied to. Contains a list of strings.
transformedGrid: Arrange multiple sources in a grid by offseting sources with a grid spacing. The fieldnestedSourcesis required.centerAtOrigin: Center the views at the origin for 3d sources.name: Name of this transformation.nestedSources: Contains a list of arrays.positions: Grid positions for the sources. If not specified, the sources will be arranged in a square grid. If given, must have the same length assourcesand contain 2d grid positions specified as [y, x]. Contains a list of arrays.sourceNamesAfterTransform: Contains a list of arrays.timepoints: The valid timepoints for this transformation. If none is given, the transformation is valid for all timepoints. Contains a list of integers.
uiSelectionGroup: Name of the UI from which this view can be selected.viewerTransform: A viewer transform to specify position, rotation, timepoint and/or zoom.Must contain exactly one of the following items:-
timepoint: The initial timepoint shown in the viewer.
-
normalVector: The normal vector to the view plane. Contains a list of numbers.timepoint: The initial timepoint shown in the viewer.
-
affine: Affine transformation applied by the viewer. Contains a list of numbers.timepoint: The initial timepoint shown in the viewer.
-
normalizedAffine: Normalized affine transformation applied by the viewer. Contains a list of numbers.timepoint: The initial timepoint shown in the viewer.
-
position: Position that will be centered in the viewer. Contains a list of numbers.timepoint: The initial timepoint shown in the viewer.
-
Examples:
{
  "default": {
    "isExclusive": false,
    "sourceDisplays": [
      {
        "imageDisplay": {
          "blendingMode": "sum",
          "color": "r255-g255-b255-a255",
          "contrastLimits": [
            290,
            23000
          ],
          "name": "em-overview",
          "opacity": 1.0,
          "sources": [
            "em-overview"
          ]
        }
      }
    ],
    "sourceTransforms": [
      {
        "affine": {
          "name": "MapScaleMat",
          "parameters": [
            -0.10198378825464686,
            -0.9710562907353596,
            0.0,
            0.0,
            -0.9846441741918877,
            0.11862126451903302,
            0.0,
            0.0,
            0.0,
            0.0,
            29.30832356389215,
            0.0
          ],
          "sources": [
            "em-overview"
          ]
        }
      },
      {
        "affine": {
          "name": "Translation",
          "parameters": [
            1.0,
            0.0,
            0.0,
            481.249,
            0.0,
            1.0,
            0.0,
            493.667,
            0.0,
            0.0,
            1.0,
            0.0
          ],
          "sources": [
            "em-overview"
          ]
        }
      },
      {
        "affine": {
          "name": "manual_shift_a3",
          "parameters": [
            1.0,
            0.0,
            0.0,
            1.7940359100750243,
            0.0,
            1.0,
            0.0,
            -6.6635619517072655,
            0.0,
            0.0,
            1.0,
            0.0
          ],
          "sources": [
            "em-overview"
          ]
        }
      }
    ],
    "uiSelectionGroup": "bookmark"
  }
}
{
  "highmag_tomos": {
    "isExclusive": true,
    "sourceDisplays": [
      {
        "imageDisplay": {
          "blendingMode": "alpha",
          "color": "r255-g255-b255-a255",
          "contrastLimits": [
            30,
            240
          ],
          "name": "highmag_tomos_images",
          "opacity": 1.0,
          "sources": [
            "tomo_37_hm",
            "tomo_38_hm",
            "tomo_40_hm",
            "tomo_41_hm",
            "tomo_53_hm",
            "tomo_54_hm"
          ]
        }
      },
      {
        "regionDisplay": {
          "lut": "glasbey",
          "name": "highmag_tomos",
          "opacity": 0.5,
          "sources": {
            "0": [
              "tomo_37_hm"
            ],
            "1": [
              "tomo_38_hm"
            ],
            "2": [
              "tomo_40_hm"
            ],
            "3": [
              "tomo_41_hm"
            ],
            "4": [
              "tomo_53_hm"
            ],
            "5": [
              "tomo_54_hm"
            ]
          },
          "tableSource": "highmag_tomos"
        }
      }
    ],
    "sourceTransforms": [
      {
        "transformedGrid": {
          "centerAtOrigin": true,
          "nestedSources": [
            [
              "tomo_37_hm"
            ],
            [
              "tomo_38_hm"
            ],
            [
              "tomo_40_hm"
            ],
            [
              "tomo_41_hm"
            ],
            [
              "tomo_53_hm"
            ],
            [
              "tomo_54_hm"
            ]
          ]
        }
      }
    ],
    "uiSelectionGroup": "bookmark"
  }
}
{
  "Figure2c": {
    "isExclusive": true,
    "sourceDisplays": [
      {
        "imageDisplay": {
          "blendingMode": "alpha",
          "color": "r255-g255-b255-a255",
          "contrastLimits": [
            150.0,
            45700.0
          ],
          "name": "em-detail-a3",
          "opacity": 1.0,
          "showImagesIn3d": false,
          "sources": [
            "em-detail-a3-A"
          ],
          "visible": true
        }
      },
      {
        "imageDisplay": {
          "blendingMode": "alpha",
          "color": "r255-g255-b255-a255",
          "contrastLimits": [
            30000,
            35000
          ],
          "name": "tomo_38_lm",
          "opacity": 1.0,
          "sources": [
            "tomo_38_lm"
          ]
        }
      },
      {
        "imageDisplay": {
          "blendingMode": "alpha",
          "color": "white",
          "contrastLimits": [
            70.0,
            235.0
          ],
          "name": "tomo_38_hm",
          "opacity": 1.0,
          "sources": [
            "tomo_38_hm"
          ]
        }
      },
      {
        "imageDisplay": {
          "blendingMode": "sum",
          "color": "r255-g0-b0-a255",
          "contrastLimits": [
            55.0,
            400.0
          ],
          "name": "fluorescence-a3-c0",
          "opacity": 1.0,
          "showImagesIn3d": false,
          "sources": [
            "fluorescence-a3-c0"
          ],
          "visible": true
        }
      },
      {
        "imageDisplay": {
          "blendingMode": "sum",
          "color": "r0-g255-b0-a255",
          "contrastLimits": [
            40.0,
            250.0
          ],
          "name": "fluorescence-a3-c1",
          "opacity": 1.0,
          "showImagesIn3d": false,
          "sources": [
            "fluorescence-a3-c1"
          ],
          "visible": true
        }
      },
      {
        "imageDisplay": {
          "blendingMode": "sum",
          "color": "r0-g0-b255-a255",
          "contrastLimits": [
            40.0,
            400.0
          ],
          "name": "fluorescence-a3-c2",
          "opacity": 1.0,
          "showImagesIn3d": false,
          "sources": [
            "fluorescence-a3-c2"
          ],
          "visible": true
        }
      },
      {
        "regionDisplay": {
          "boundaryThickness": 0.2,
          "colorByColumn": "annotationColor",
          "lut": "argbColumn",
          "name": "lm-tomo-annotations",
          "opacity": 1.0,
          "selectedRegionIds": [
            "0;1"
          ],
          "showAsBoundaries": true,
          "sources": {
            "1": [
              "tomo_38_lm"
            ]
          },
          "tableSource": "lm-tomogram-table"
        }
      },
      {
        "regionDisplay": {
          "boundaryThickness": 0.2,
          "colorByColumn": "annotationColor",
          "lut": "argbColumn",
          "name": "hm-tomo-annotations",
          "opacity": 1.0,
          "showAsBoundaries": true,
          "sources": {
            "1": [
              "tomo_38_hm"
            ]
          },
          "tableSource": "highmag_tomos"
        }
      }
    ],
    "sourceTransforms": [
      {
        "affine": {
          "name": "MapScaleMat",
          "parameters": [
            -0.18777152869337194,
            0.9821399838237337,
            0.0,
            0.0,
            1.0032799126909004,
            0.16846097748363031,
            0.0,
            0.0,
            0.0,
            0.0,
            99.62143853357243,
            0.0
          ],
          "sources": [
            "em-detail-a3-A"
          ]
        }
      },
      {
        "affine": {
          "name": "Translation",
          "parameters": [
            1.0,
            0.0,
            0.0,
            203.422,
            0.0,
            1.0,
            0.0,
            238.934,
            0.0,
            0.0,
            1.0,
            0.0
          ],
          "sources": [
            "em-detail-a3-A"
          ]
        }
      },
      {
        "affine": {
          "name": "affine0",
          "parameters": [
            0.013245148924148945,
            1.0039595803164607,
            0.0,
            239.93945962096353,
            1.0206688295391182,
            -0.034661042654656964,
            0.0,
            300.37466120697667,
            0.0,
            0.0,
            1.0,
            -0.191475
          ],
          "sources": [
            "tomo_38_lm"
          ]
        }
      },
      {
        "affine": {
          "name": "affine0",
          "parameters": [
            0.013245148924148947,
            1.0039595803164607,
            0.0,
            243.59201639109855,
            1.0206688295391182,
            -0.03466104265465697,
            0.0,
            303.91519667035317,
            0.0,
            0.0,
            1.0,
            -0.0701
          ],
          "sources": [
            "tomo_38_hm"
          ]
        }
      },
      {
        "affine": {
          "name": "Translation",
          "parameters": [
            100.23021139885087,
            13.287015421562778,
            0.0,
            165.3568,
            -13.287015421562778,
            100.23021139885087,
            0.0,
            2243.2063,
            0.0,
            0.0,
            15.423117146329398,
            0.0
          ],
          "sources": [
            "fluorescence-a3-c0",
            "fluorescence-a3-c1",
            "fluorescence-a3-c2"
          ]
        }
      },
      {
        "affine": {
          "name": "MapScaleMat",
          "parameters": [
            -0.0018848506050240675,
            0.009858721157622638,
            0.0,
            0.0,
            0.010070923763591259,
            0.001691011291980681,
            0.0,
            0.0,
            0.0,
            0.0,
            1.0,
            0.0
          ],
          "sources": [
            "fluorescence-a3-c0",
            "fluorescence-a3-c1",
            "fluorescence-a3-c2"
          ]
        }
      },
      {
        "affine": {
          "name": "CLEMRegistration",
          "parameters": [
            1.0,
            0.0,
            0.0,
            203.422,
            0.0,
            1.0,
            0.0,
            238.934,
            0.0,
            0.0,
            1.0,
            0.0
          ],
          "sources": [
            "fluorescence-a3-c0",
            "fluorescence-a3-c1",
            "fluorescence-a3-c2"
          ]
        }
      }
    ],
    "uiSelectionGroup": "mobie-paper",
    "viewerTransform": {
      "normalizedAffine": [
        0.06345607117925063,
        0.0,
        0.0,
        -15.741442519524742,
        0.0,
        0.06344640651225365,
        0.0,
        -19.442105775080794,
        0.0,
        -0.0011074611451334798,
        0.06344640651225365,
        0.3410102495449885],
      "timepoint": 0
    }
  }
}